Where you place aggregate data is essential to getting the correct results. For aggregate calculations, such as SUM, AVERAGE, MAX, and MODE, which process a set of values and return one value, you typically insert the aggregate data in the following places in a table:
At the beginning of a group, in the group header row
At the beginning of a table, in the header row
At the end of a group, in the group footer row
At the end of the table, in the footer row
You can place this type of aggregate data in a table’s detail row, but the data would not make much sense because the same aggregate value would appear repeatedly for every row in the group. On the other hand, insert aggregate calculations, such as RUNNINGSUM, MOVINGAVE, PERCENTRANK, and RANK, in the detail row of a table. These functions process a set of values and return a different value for each row.
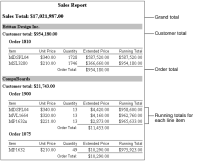
The report in Figure 10‑3 groups data rows by customer, then by order ID. It displays totals for each order, totals for each customer, and a grand total of all sales. At the detail level, the report displays the running total for each line item.
Figure 10‑3 Report showing totals for groups and running totals for detail rows
To display the aggregate data as shown in the preceding report example, place the aggregate data in these locations:
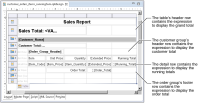
To display the grand total at the beginning of the report, place the aggregate data in the table’s header row.
To display the customer total at the beginning of each customer group, place the aggregate data in the customer group’s header row.
To display the order total at the end of each order group, place the aggregate data in the order group’s footer row.
To display the running totals, place the aggregate data in the table’s detail row.