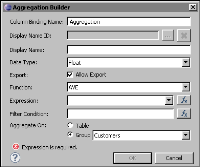
As with all dynamic or computed data, you must create a column binding for each aggregation. To display the aggregate data, use a text or data element that refers to the column binding. BIRT Report Designer provides a tool, Aggregation Builder, to help create the column binding and the aggregation. Figure 10‑5 shows Aggregation Builder displaying default values.
Access Aggregation Builder, using one of the following procedures:
In the palette, under Quick Tools, drag the aggregation element and drop it in the desired location in a table. Use this procedure to display just the aggregate value, for example, 55. The aggregation element is a shortcut to inserting a data element and associating it with a column binding that defines the aggregation.
Select the table in which to place aggregate data, choose the Binding tab in Property Editor, then choose Add Aggregation. Use this procedure to use the aggregate value within another expression, for example, to:
Display the aggregate value with static text, as shown in the following example:
Number of rows: 55
Use the aggregate value in a conditional expression, as shown in the following example:
row["Order_Total"] Greater Than or Equal 10000
When defining an aggregation in Aggregation Builder, take care to provide the required information properly, or the report generates unexpected results. Table 10‑2 describes the information required for all aggregations.
Table 10‑2 Required information for defining an aggregation
Property
Description
Column Binding Name
Use a short but descriptive name that describes the aggregate value that is returned by the column binding, for example, Grand_Total, Customer_Total, and Order_Total. Every column binding in a report must have a unique name.
Data Type
Most aggregate values are numbers, so you typically select either Decimal, Float, or Integer as the data type. The type you select depends on the type of the values being aggregated, and on the level of precision the report requires. For example, the decimal type is often used for currency values. If you select Integer instead, the numbers are rounded, which is less precise. If performance is more important than a high level of precision, use Float instead of Decimal.
Function
Select the function that performs the aggregate calculation you want. The functions are described in Table 10‑1.
Expression
Select the data set field that contains the values to aggregate, or specify an expression.
Aggregate On
Select the data rows to include in the aggregate calculation.
Select Table to perform the calculation over all the data rows in the table.
Select a specific group to perform the calculation over the data rows in that group.
Selecting the wrong item produces incorrect results. For example, if you place aggregate data in a customer group header, but select Table as the Aggregate On value, the customer group header displays the aggregate value for the table, not the aggregate value for the customer group.
Most aggregate functions require only the information described in Table 10‑2. Some functions, such as IS-TOP-N, MOVINGAVE, QUARTILE and WEIGHTEDAVE, require additional information, which appears in Aggregation Builder after you select the function. For information about the additional information to supply for these functions, read the function descriptions in Table 10‑1.
The rest of this section describes how to create the aggregations to calculate the subtotals and totals that appear in the report example in the previous section.
Displaying the grand total in the table’s header row
In the report example, a text element displays the sales grand total, using the following combination of static text and dynamic data:
Sales Total: $17,021,987.00
First, calculate the sales grand total by defining the aggregation in a column binding. Then, insert a text element that uses this column binding.
How to calculate the grand total
1 Select the table that contains the report data.
2 In Property Editor, choose the Binding tab. The Binding page displays all the column bindings defined and used by elements in the table.
3 In the Binding page, choose Add Aggregation.
4 In Aggregation Builder, specify the following information:
1 In Column Binding Name, type the following name for the column binding:
Grand_Total
2 In Data Type, use the default, Float, as the type of the aggregate value.
3 In Function, select SUM.
4 In Expression, select the data set field, Extended_Price, that contains the values to sum.
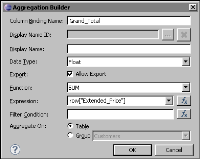
5 In Aggregate On, select Table to perform the aggregate calculation over all the rows in the table. Figure 10‑6 shows the complete definition.
Figure 10‑6 Aggregation Builder displaying values for getting the sales total for the table
Choose OK. The Grand_Total column binding is now available to any report element you place in the table.
How to use the column binding in a text element
1 Drag a text element from the palette and drop it in the table header row.
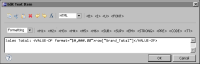
2 In Edit Text Item, select HTML from the drop-down list that displays Auto.
3 Type the following text, as shown in Figure 10‑7:
Figure 10‑7 Text, containing static text and dynamic data, specified for the text element
The expression, row["Grand_Total"], refers to the column binding you created to calculate the sales grand total.
4 Choose OK to save the expression specified for the text element.
Displaying the customer total in the customer group header
In the report example, a text element displays the customer total, using the following combination of static text and dynamic data:
Customer Total: $954,180.00
Just as you did to calculate and display the sales grand total, first, calculate the customer total by defining the aggregation in a column binding. Then, insert a text element that uses this column binding.
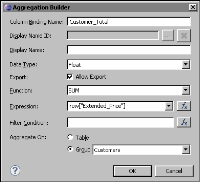
Figure 10‑8 shows the definition of the column binding and aggregation in Aggregation Builder. The aggregation uses the SUM function to add all the values in the Extended_Price field, for all rows in each customer group.
Figure 10‑8 Aggregation Builder displaying values for getting the sales total for each customer group
The text element in the customer group header row contains the following expression to display the customer totals:
Displaying the order total in the order group footer
In the report example, a data element displays the order total. Unlike the previous procedures in which text elements are used to display static text with the aggregate value, the data element is used to display just the order total value.
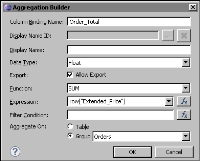
In this case, drag the aggregation element from the palette, and drop it in the order group footer. In Aggregation Builder, specify the values as shown in Figure 10‑9. The aggregation uses the SUM function to add all the values in the Extended_Price field, for all rows in each order group.
Figure 10‑9 Aggregation Builder displaying values for getting the total for each order group
In the report design, the data element displays the sigma symbol followed by the column binding name, as shown in the following example:
[Order_Total]
Displaying the running total in the detail rows
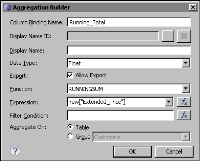
In the report example, a data element displays the running total. Drag the aggregation element from the palette, and drop it in the detail row. In Aggregation Builder, specify the values as shown in Figure 10‑10. This time, use the RUNNINGSUM function, rather than the SUM function, and aggregate on all the rows in the table.
Figure 10‑10 Aggregation Builder displaying values for getting the running total for each detail row
Viewing the column bindings for the report
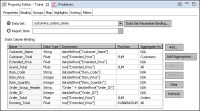
Figure 10‑11 shows the column bindings defined for the table that contains all the report data. Review the four column bindings that define aggregations. The Aggregate On values indicate the level at which aggregate calculations apply. The ALL value indicates that the aggregate calculation is applied to all rows in the table. The Customers and Orders values indicate that the aggregate calculations are applied to rows in the Customers group and to rows in the Orders group, respectively. The N/A value indicates that the expression is not an aggregation.
Figure 10‑11 Column bindings used by elements in the table