To provide more meaningful analysis, a report that displays subtotals and totals frequently also displays percentages. For example, if a report groups revenues by regions for a given quarter, it is useful to know both the actual revenue for each region and the percentage of revenues generated by each region.
Some percentages are calculated at the detail level, where each number in a row is calculated as a percentage of the total of all rows in a group. Some percentage calculations require aggregate values from two different groups of data. For example, a report displays each regional sales total as a percentage of the total national sales. To calculate this aggregate data for each region, two totals are required:
The total of all sales in each region
The overall total of sales across all regions
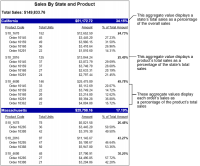
Figure 10‑14 shows an example of a report that displays sales data that is grouped by state, then by product.
Figure 10‑14 Percentage calculations in a grouped report
This report shows the following three percentage calculations:
A state’s total sales as a percentage of the overall sales
A product’s total sales as a percentage of the state’s total sales
An order’s sales as a percentage of the product’s total sales
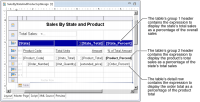
Figure 10‑15 Percentage calculations in a report design
Calculating each order total as a percentage of the product sales total
As the report in Figure 10‑14 shows, the order information appearing in the report’s detail rows is grouped by product code. The amount of each order is displayed in the Amount column. The percent number that appears next to each amount represents that order’s total as a percentage of the product’s sales total.
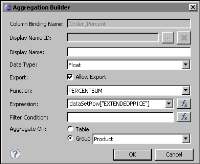
To display that value for each order, insert an aggregation element in the detail row, then use the PERCENTSUM function, as shown in Figure 10‑16. The Aggregate On value is Product group, which indicates that each aggregate value is a percentage of the total of the rows in a product group.
Figure 10‑16 The Order_Percent column binding uses the PERCENTSUM function
Calculating the product’s sales total as a percentage of a state’s sales total
Unlike the previous percentage calculation, the example report does not use the PERCENTSUM function to calculate the product’s sales total as a percentage of a state’s sales total. You use PERCENTSUM only for values in the detail row. You cannot use this function to calculate percentage values that require data from two different groups, which, in this example, are the product and state groups.
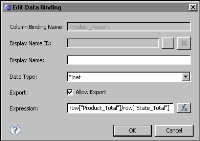
The report shown in Figure 10‑15 uses two column bindings, Product_Total and State_Total, to calculate a product’s sales total and a state’s sales total, respectively. These column bindings are then used in an expression in another column binding, Product_Percent, to calculate the product’s sales total as a percentage of a state’s sales total. Insert a data element, then specify the expression. As Figure 10‑17 shows, the expression in Product_Percent is:
row["Product_Total"]/row["State_Total"]
Figure 10‑17 The Product_Percent column binding uses the Product_Total and State_Total column bindings in an expression
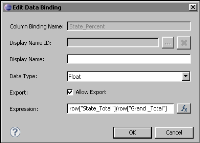
Calculating the state’s sales total as a percentage of the overall sales total
The report shown in Figure 10‑15 uses two column bindings, Grand_Total and State_Total, to calculate the overall sales and a state’s sales total, respectively. These column bindings are used in an expression in another column binding, State_Percent, to calculate the state’s sales total as a percentage of the overall sales total. As Figure 10‑18 shows, the expression in State_Percent is:
row["Product_Total"]/row["State_Total"]
Figure 10‑18 The State_Percent column binding uses the State_Total and Grand_Total column bindings in an expression
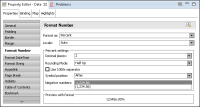
Displaying the percentage values in the correct format
The values returned by the previous calculations range from 0 to 1. To display a value, such as 0.8, as 80%, use the following procedure:
1 Select the data element that displays the percentage value.
2 In Property Editor, choose Format Number, then choose the Percent format.
3 Choose the settings, including the number of decimal places and the placement of the percent symbol. Figure 10‑19 shows an example of specifying the percent format for numbers in a data element.
Figure 10‑19 Percent format specified for numbers in a data element