A cross tab displays data in a row-and-column matrix that looks similar to a spreadsheet. Like a spreadsheet, the cross tab is ideal for summarizing data in a compact and concise format. It displays summary, or aggregate, values such as sums, counts, or averages. The cross tab groups these values by one set of data listed down the left side of the matrix and another set of data listed across the top of the matrix.
Figure 24‑1 shows a cross tab that displays sales totals by state and by product line. The cross tab uses data from three fields: state, productline, and extendedprice.
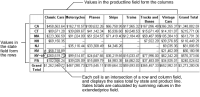
Figure 24‑1 Cross tab displaying sales totals by state and product line
As Figure 24‑1 shows, a cross tab typically uses data from at least three fields.
One field populates the column headings in the cross tab. There is one column for each unique value in the field. In the example shown in Figure 24‑1, there are five unique values in the productline field: Classic Cars, Motorcycles, Planes, Ships, and Trains.
One field populates the row headings in the cross tab. There is one row for each unique value in the field. In the example, there are eight unique values in the state field: CA, CT, MA, NH, NJ, NV, NY, and PA.
One field’s values are aggregated, and these values populate the cells of the cross tab. In the example, each cell displays a sales total by product line and by state. The sales total is calculated using the SUM function on the values in the extendedprice field.
This section begins with a tutorial in which you build a cross tab similar to the one shown in Figure 24‑1. The tutorial leads you through the essential tasks. The rest of the section expands on some of the concepts, such as data cubes, which are unique to cross tabs.