As the tutorial demonstrates, when setting up data for a cross tab, you create at least one data source and one data set, just as you would to prepare data for other report elements. Unlike a table, a list, or a chart, however, you cannot insert a data set field directly in a cross tab.
To set up data for a cross tab, there is one additional step to perform: creating a cube. The data that you insert in a cross tab must come from a cube. As the tutorial also demonstrates, you build a cube using data from a data set. Figure 24‑24 illustrates how the cross tab gets its data.
Figure 24‑24 How the cross tab gets data
If you are wondering why there is an additional data entity, the answer is that the cube offers a far more powerful way to store numeric data for fast analysis.
About cubes
Commonly associated with online analytical processing (OLAP) technology, a cube is a multidimensional data structure that is optimized for analysis and reporting. A cube organizes data into dimensions and measures. Measures represent values that are counted or aggregated, such as costs or units of products. Dimensions are categories, such as products, customers, or sales periods, by which measures are aggregated. For example, a retail cube might contain data that supports viewing sales volume and cost of goods, which are measures, by store location, time period, and product lines, which are dimensions.
Dimensions can be hierarchical and contain multiple levels. For example, a region dimension can contain a region-country-state hierarchy. Similarly, a time dimension can contain a year-quarter-month-week hierarchy. Most cubes include a time dimension because, for most reports, showing measures by day, week, month, quarter, or year is essential to analyzing data. The time dimension is a special dimension. The cube groups dates stored in a field into any time period of your choice.
Planning the data
Before building a data set or a cube, think about the aggregate data you want to display in the cross tab, and how you want to categorize the aggregate data. For example:
Average score and high score by year by school district
Sales volume by month by product by store
Call volume and average call time by support person by day and by call type
After deciding the information to display in the cross tab, you can identify which data fields to define as measures and dimensions in the cube. In the first example, the measures are average score and high score, and the dimensions are year and school district.
After identifying the contents of the cube, you know what data to retrieve from the data source. Figure 24‑25 shows the data planning flow.
Figure 24‑25 How to plan the data to display in a cross tab
Notice that the planning steps are in the reverse order of the implementation steps. Start with the end result and work backward to determine the best way to get the results you want. If you have control of the data source as well—the database, for example—you can go a step further and create a database schema that supports the queries to return data for a cube.
Most report developers, however, neither create nor maintain corporate databases or other information systems. The rest of this section provides some guidelines for designing data sets and cubes, given the typical ways databases are structured.
Designing the cube
In theory, it is possible to create a cube with any number of dimensions and measures. You might be tempted to create a cube that stores all measures against every combination of dimensions. This approach is not practical in real-world applications. The number of aggregations increases exponentially with the number of measures and dimensions. The higher the number of aggregations BIRT must calculate, the greater the amount of time and computer resources BIRT requires.
Therefore, for each cross tab you want to create, design a cube that provides only the data to display in that cross tab.
Observe the following rules:
Cube data can be used in cross tabs and charts only. You cannot use cube data in a table or list.
A cross tab or chart can use data from one cube only. This requirement is similar to tables, lists, and charts using data from one data set only.
The cube’s data structure is symmetric to the cross tab’s structure. The cube organizes measures by dimensions, and the cross tab displays aggregate data (measures) by any number of data groups (dimensions). This symmetry makes designing a cube intuitive and straightforward. Determine what your users want to see and how they want to see it, and define the measures and dimensions for the cube accordingly.
Designing data sets for a cube
This design phase requires more thought and planning. The data set must accomplish two key things. It must retrieve data from the source in a resource‑efficient manner and also in a way that makes sense for the cube. How you write the SQL query to get the data depends on how the database is structured. When planning how to get data for a cube, you also have to decide whether to build one data set or multiple data sets.
BIRT supports the creation of cubes using data from a single data set or multiple data sets to support the different ways data sources can be structured, and report developers’ different levels of expertise. In other words, the decision to build one or multiple data sets to get data for a cube depends on how the data source is structured, and also on your grasp of OLAP design principles.
The cube builder in BIRT is designed for report developers with varying OLAP expertise. You do not have to know much about OLAP to build a data set or a cube for a cross tab, but if you have the expertise, you can design data sets that apply OLAP design principles for optimal performance.
It is beyond the scope of this book to teach OLAP principles, but an introduction to the subject might help you decide whether it is worth exploring OLAP further.
Comparing OLTP and OLAP
Online Transaction Processing (OLTP) systems and Online Analytical Processing (OLAP) systems are two common database structures. Each serves a different purpose.
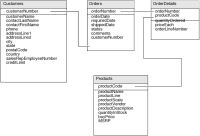
OLTP is the standard, normalized database structure designed for transactions, where data inserts, updates, and deletes must be fast. One of the ways OLTP systems optimize the entry or updates of records is by minimizing repeated data. For example, complete information about an order includes an order number, a customer name, a bill-to address, a ship-to address, and a payment method. The order details include a product number, a product description, the quantity ordered, and the unit price. In a flat structure, each order detail record would need all that information. That is a lot of repeated information, which is why OLTP systems use relational technology to link the information. The Classic Models, Inc. sample database is an example of an OLTP database. Figure 24‑26 shows a partial view of the Classic Models, Inc. schema. Tables are linked to one another by keys.
Figure 24‑26 A partial view of the Classic Models, Inc. schema
By contrast, OLAP is a database structure designed for performing analysis to reveal trends and patterns among data. This structure more closely represents the way people ask questions or want to view data. For example:
What are the sales amounts for each product this month?
Are product sales up or down compared to previous months?
What products saw the greatest increase this quarter?
In what regions did product sales increase this quarter?
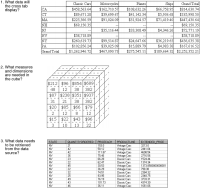
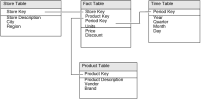
Figure 24‑27 shows an example of an OLAP structure.
Figure 24‑27 An OLAP schema
This particular OLAP structure is commonly referred to as a star schema because the schema diagram is shaped like a star, that is, one in which points radiate from a central table. The central table is called a fact table, and the supporting tables linked to it are dimension tables. As Figure 24‑27 shows, the fact table contains the measures and keys to link to each dimension table. The dimension tables do not link to one another.
Many-to-one relationships exist between the keys in the fact table and the keys they reference in the dimension tables. For example, the Product table defines the products. Each row in the Product table represents a distinct product and has a unique product identifier. Each product identifier can occur multiple times in the Sales fact table, representing sales of that product during each period and in each store.
Designing a single data set
Design a single data set if:
You are retrieving data from a database that uses an OLTP structure.
You are well‑versed in writing SQL joins. Because an OLTP structure minimizes repeated data, you typically have to join many tables to get all the data you need. The query you created in the tutorial joined four tables to get data for a cube that contained only two dimensions and one measure.
You find it too complicated to create data sets from a OLTP structure to resemble a star schema. This exercise can feel like fitting a square peg into a round hole.
The disadvantage of creating a single data set is that, typically, it must use multiple joins. These joins are complex to create and increasing the number of joins can slow queries.
Designing multiple data sets in a star schema
Create multiple data sets to retrieve data for a cube if:
You are retrieving data from a database that uses an OLAP star schema.
You are familiar with star schemas.
The number of joins required to get the data from multiple tables is too complex and degrades performance.
If the database uses a star schema, you can create data sets that mimic the structure, one data set for each fact table and dimension table in the star schema.
If the database uses an OLTP structure, you can also create one data set to retrieve the data to calculate the measures, and one data set for each dimension. Because you are trying to map data from an OLTP structure to data in a OLAP star schema, the mapping process is less intuitive, and you might also find that you still need to create multiple joins in each data set.
Building a multi-dataset cube
The preceding tutorial walked through the steps for building a cube that used data from a single data set. In this section, you learn how to create a multi-dataset cube. Because the concepts and procedures are easier to understand with an example, this section walks through the steps for performing the following tasks:
Creating the data sets to retrieve data from the Orders, OrderDetails, and Products tables in the Classic Models, Inc. sample database
Using data from the data sets to build a cube that contains a sales amount measure, a product line dimension, and a year dimension
How to create data sets for a multi-dataset cube
In this procedure, you create two data sets:
A fact data set, SalesTotal, to retrieve the data for calculating the sales totals
A dimension data set, Productlines, to retrieve data about the product lines
Note that we are not creating a separate data set for the year dimension, as is typical in a star schema. It is sometimes too complicated to create a pure star schema design when working with data stored in an OLTP system.
1 Create a new data set named SalesTotals. Create the following query:
from CLASSICMODELS.ORDERDETAILS, CLASSICMODELS.ORDERS
where CLASSICMODELS.ORDERS.ORDERNUMBER = CLASSICMODELS.ORDERDETAILS.ORDERNUMBER
and CLASSICMODELS.ORDERS.STATUS = 'Shipped'
The query does the following:
Retrieves PRODUCTCODE data because it is the key to later link to the PRODUCTLINE dimension
Retrieves SHIPPEDDATE data to use for the year dimension
Creates a calculated column, EXTENDED_PRICE, used to aggregate values to calculate the sales totals
Creates a join between the Orders and OrderDetails tables to get all the necessary data about the orders. Because the data set is retrieving data from an OLTP database, joins are unavoidable
Defines a filter condition to retrieve order data for orders that have been shipped, and therefore, that have been paid
2 Create a new data set named ProductLines. Create the following query:
select CLASSICMODELS.PRODUCTS.PRODUCTLINE,
CLASSICMODELS.PRODUCTS.PRODUCTCODE
from CLASSICMODELS.PRODUCTS
The query does the following:
Retrieves PRODUCTLINE data to use for the PRODUCTLINE dimension
Retrieves PRODUCTCODE data because it is the key that the SalesTotals data set will need to reference
How to create a multi-dataset cube
1 In Data Explorer, right-click Data Cubes, then choose New Data Cube.
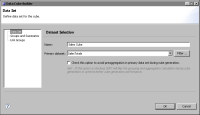
2 In the Dataset page of Cross Tab Cube Builder, supply the following information, as shown in Figure 24‑28:
1 In Name, specify a descriptive name, such as Sales Cube, for the cube.
2 In Primary dataset, select SalesTotals. In a multi-dataset cube, the fact data set that retrieves the data to calculate measures is the primary data set.
Figure 24‑28 Name and primary data set specified for a cube
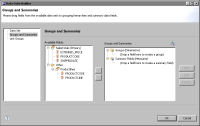
3 Choose Groups and Summaries to define the dimensions and measures for the cube. The Groups and Summaries page, shown in Figure 24‑29, displays the available data sets and fields.
Figure 24‑29 Groups and Summaries page shows the available data sets and fields
4 Define the product line dimension, using the following steps:
1 Under the Productlines data set, drag PRODUCTLINE and drop it under Groups (Dimensions) in the drop location that displays the following text:
(Drop a field here to create a group)
2 In Add Group, use the default group name.
3 Under the Productlines data set, drag PRODUCTCODE and drop it on the PRODUCTLINE dimension. This action creates a hierarchical relationship between PRODUCTLINE and PRODUCTCODE.
5 Define the year dimension of the cube.
1 Under the SalesTotals (Primary) data set, drag SHIPPEDDATE and drop it under Groups (Dimensions) in the drop location that displays the following text:
(Drop a field here to create a group)
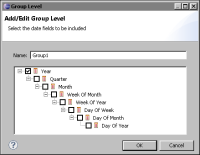
Group Level displays the different ways to group the dates. To display the dates as they appear in the data source, select Regular Group. To group the dates by any of the time periods, select Date Group.
2 Select Date Group, then select Year, as shown in Figure 24‑30.
Figure 24‑30 Group Level showing the year group selected
3 Choose OK to save the year dimension.
6 Define the cube’s measure. Under the SalesTotals (Primary) data set, drag EXTENDED_PRICE and drop it under Summary Fields (Measures) in the drop location that displays the following text:
(Drop a field here to create a summary field)
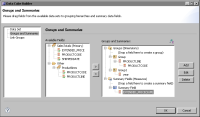
The Groups and Summaries page, shown in Figure 24‑31, displays the defined dimensions and measure.
Figure 24‑31 Groups and Summaries page shows the dimensions and measure
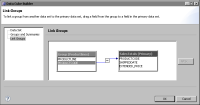
7 Link the data in the dimensions with the fact data set.
1 Choose Link Groups. The Link Groups page displays the Productline dimension you created and the primary (fact) data set.
2 Link the PRODUCTCODE field in both items, as shown in Figure 24‑32.
Figure 24‑32 Link Groups page shows the dimension and fact data sets linked
8 Choose OK to save the cube. You can now build a cross tab that uses data from this cube.
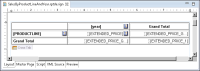
Figure 24‑33 shows a cross tab that uses the year and PRODUCTLINE dimensions and the EXTENDED_PRICE measure from the cube.
Figure 24‑33 Cross tab design
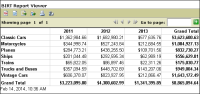
Figure 24‑34 shows the generated cross tab after formatting enhancements.