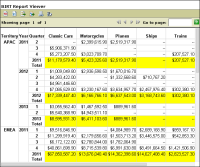
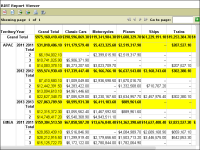
You can display totals for each dimension that you add to a cross tab, and for each level within a multilevel dimension. The cross tab in Figure 24‑49 displays sales data by product line, state, year, and quarter. The rows and columns that display the subtotals and grand totals are highlighted.
Figure 24‑49 Cross tab displaying sales subtotals
BIRT does not create the subtotal and grand total rows and columns by default. You choose whether to display grand totals, and which subtotals to display.
How to display subtotals and grand totals
1 Select the cross tab.
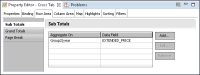
2 In Property Editor, choose the Row Area tab or the Column Area tab to add a subtotal or grand total in the row area and column area, respectively.
Figure 24‑50 Adding a subtotal to a cross tab’s row area
3 To create a subtotal, select Sub Totals, then choose Add. To create a grand total, select Grand Totals, then choose Add.
A cross tab can always include grand totals. If a row or column area consists of only one dimension, however, there can be no subtotals. The Add button is disabled if you cannot create a subtotal.
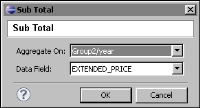
4 In Sub Total or Grand Total, specify the following information:
1 In Aggregate On, select the dimension or dimension level for which to display the total.
2 In Data Field, select the summary field for which to aggregate values.
Figure 24‑51 shows an example of displaying subtotals for the year dimension.
Figure 24‑51 Specifying a subtotal in a cross tab
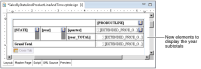
3 Choose OK.
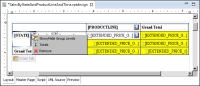
A new row or column, which contains a label and a data element, is added to the cross tab. For the subtotal example shown in Figure 24‑51, a label in the new row displays [year_TOTAL], and a data element displays [EXTENDED_PRICE], as shown in Figure 24‑52.
Figure 24‑52 Elements that display year subtotals in a cross tab
Displaying totals before the detail data
In the report shown in Figure 24‑49, the cross tab displays subtotals and grand totals after the detail data. If you prefer, you can display totals before the detail data. The cross tab in Figure 24‑53 shows the same data as the cross tab in Figure 24‑49, except that the grand totals appear in the first column and in the first row, and the year subtotals appear before the quarter values.
Figure 24‑53 Cross tab displaying subtotals and grand totals before the measure values
How to display totals before the detail data
1 Click the button next to any data element that displays dimension values, as shown in Figure 24‑54.
Figure 24‑54 Accessing the Totals command
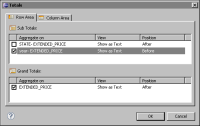
2 Choose Totals. Totals shows the subtotals and grand totals that the cross tab displays in the row area and the column area.
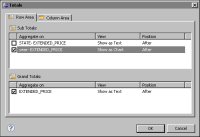
3 For each subtotal or grand total row or column that you want to display before the detail data, under Position, click After, then select Before, as shown in Figure 24‑55.
Figure 24‑55 Totals displaying the cross tab’s subtotals and grand totals
4 Choose OK.
Displaying totals as charts
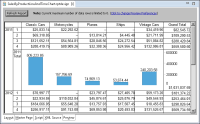
If a cross tab consists of many rows and columns, users might find it difficult to read and compare totals. Displaying totals as charts can improve the readability of the data. Figure 24‑56 shows a cross tab where the year totals appear as a chart. You can easily compare the sales totals of each product line for a given year.
Figure 24‑56 Cross tab displaying year totals as a chart
How to display totals as charts
1 Click the button next to any data element that displays dimension values.
2 Choose Totals. Totals shows the subtotals and grand totals that the cross tab displays in the row area and the column area.
3 Select the subtotal or grand total that you want to display as a chart. Under View, click Show as Text, then select Show as Chart. Figure 24‑57 shows the year subtotal with its View option set to Show as Chart.
Figure 24‑57 Year subtotal View option set to Show as Chart
4 Choose OK. The chart appears in the cross tab. The chart’s initial size is small. To resize the chart, select it and drag the handles until the chart is at the desired size.
5 Double-click the chart to edit it in the chart builder.