Limiting the amount of data the cross tab displays
When generating a report that contains a cross tab, BIRT creates one column or one row in the cross tab for each unique value in the dimensions that you insert in the cross tab. If a cross tab displays sales totals by products in the column area and months of a particular year in the row area, and there are 100 products in the data set, the cross tab consists of at least 100 columns, 12 rows and 1200 cells, not counting a row and column for the grand totals. This cross tab is obviously too wide to view on screen or in print. You can reverse the dimensions so that the product values appear as rows, and the month values as columns, but then the cross tab is much taller.
Although there is no limit to the amount of data that a cross tab can display, limiting the amount improves the usability of the data. After all, the main advantage of presenting data in a cross tab is the ability to compare and analyze information, preferably on a single page or screen.
As with any other type of report, you narrow the scope of data to include in a cross tab by creating filter conditions. If the data originates from a database, it is best, for performance reasons, to specify the filter condition in the SQL query. Alternatively, filter at the data set level, the cube level, and finally, at the cross tab level. The filtering option you select depends on whether other report elements or cross tabs are using the same data set or cube.
When filtering data, you can choose to recalculate totals or not. For example, a cross tab displays sales by product line and state, the sales total for each product line and for each state, and the grand total of all sales. If you apply a filter to exclude certain states, you can specify whether to calculate new totals for the reduced number of states, or keep the original totals calculated for all states. While the first option is typical, you might opt for the second option if you want to see full sales totals while omitting sales data for certain states.
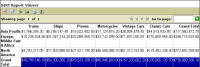
Figure 24‑79 Cross tab displaying all sales data by territory and product line
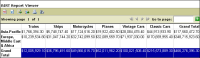
The report in Figure 24‑80 applies a filter to exclude sales data for North America and the totals are recalculated to exclude North American sales figures, as the lower numbers in the highlighted Grand Total row indicate.
Figure 24‑80 Cross tab excludes sales data for North America and recalculates totals
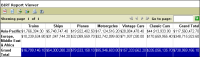
The report in Figure 24‑81 applies a filter to exclude sales data for North America but the original totals, which include North American sales figures, are maintained. The numbers in each column do not add up to the numbers shown in the Grand Total row, but the totals represent actual sales totals.
Figure 24‑81 Cross tab excludes sales data for North America but does not recalculate totals
How to filter data at the cross tab level
1 Select the cross tab.
2 In Property Editor, choose Filters and choose Add.
3 In New Filter Condition, specify the following information:
1 In Target, choose one of the following options:
Choose Group level to filter data in a specific dimension, then select a group. For example, if the cross tab displays sales totals by product line and by year, you can create a filter to display data for certain product lines or for certain years.
Choose Measure to filter measure data, then select a measure. For example, you can create a filter to display sales totals greater than a specific number.
Choose Detail to filter on a field that is not used in the cross tab, but that is defined in the cube.
In Filter Condition, the first field displays the expression of the selected group or measure. You can change this value.
2 Complete the filter condition by specifying the following information:
1 In the first field, select a dimension or a measure, or a group total for which to evaluate values. Alternatively, choose the expression builder button to create an expression.
2 In the second field, select the operator that specifies the type of filter test.
3 In the third field, specify the value to search in the dimension or measure specified in the first field. You can type a value, or choose <Select value...> to display a list of values. You can also specify an expression that evaluates to a value.
4 Select Recalculate Totals to calculate new totals based on the filtered data. Deselect Recalculate Totals to display the original totals, based on all data.
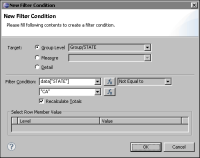
Figure 24‑82 shows an example of a complete filter condition. The filter limits the data to include only states not equal to CA.
Figure 24‑82 New Filter Condition showing an example of a complete filter condition