This tutorial provides instructions for creating a cross tab that displays sales totals by state and product line. The cross tab uses data from the Customers, OrderDetails, and Products tables in the sample database, Classic Models, Inc.
In this tutorial, you perform the following tasks:
2 In New Report, select a project in which to save your report.
3 Type the following text as the file name:
SalesByStateAndProductLine.rptdesign
4 Choose Finish. A blank report layout appears in the layout editor.
Task 2: Build a data source
Before you begin designing your report in the layout editor, create a data source to connect your report to the Classic Models, Inc. database.
1 Choose Data Explorer.
2 Right-click Data Sources, and choose New Data Source.
3 Select Classic Models Inc. Sample Database from the list of data sources, use the default data source name, then choose Next. Connection information about the new data source appears.
4 Choose Finish. BIRT Report Designer creates a new data source that connects to the sample database.
Task 3: Build a data set
In this procedure, you build a data set to indicate what data to extract from the Customers, OrderDetails, and Products tables.
1 In Data Explorer, right-click Data Sets, and choose New Data Set.
2 In New Data Set, type the following text for data set name:
Sales
3 Choose Next.
4 Use the following SQL SELECT statement to indicate what data to retrieve. Type the column and table names, or drag them from Available Items to the appropriate location in the SELECT statement.
SELECT Customers.state,
Orderdetails.quantityOrdered,
Orderdetails.priceEach,
Products.productline
FROM Customers INNERJOIN Orders ON Customers.customerNumber
= Orders.customerNumber
INNERJOIN Orderdetails ON Orders.orderNumber = Orderdetails.orderNumber
INNERJOIN Products ON Orderdetails.productCode = Products.productCode
WHERE Customers.country = 'USA'
This SELECT statement joins four tables to get the required data.
5 Choose Finish to save the data set. Edit Data Set displays the columns specified in the query, and provides options for editing the data set.
6 Choose Computed Columns, then choose New to create a computed field that calculates extended prices by multiplying values from the QUANTITYORDERED and PRICEEACH fields.
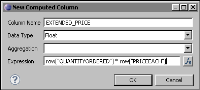
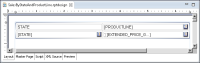
7 In New Computed Column, specify the following values, as shown in Figure 24‑2:
Figure 24‑2 Computed field EXTENDED_PRICE
1 In Column Name, type:
EXTENDED_PRICE
2 In Data Type, select Float.
3 In Expression, type:
row["QUANTITYORDERED"] * row["PRICEEACH"]
Alternatively, open the expression builder to construct the expression by selecting the appropriate data set fields. Note that data set field names are case-sensitive. If you typed row["quantityOrdered"] in the Expression field, BIRT displays an error when you preview the results returned by the data set. The case requirement for data set field names is unlike the SELECT statement where you can type table field names in any case.
4 Choose OK to save the computed field.
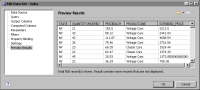
8 Choose Preview Results to confirm that the query returns the correct data. Figure 24‑3 shows some of the data rows that the data set returns.
Figure 24‑3 Preview of rows returned by the Sales data set
9 Choose OK to save the data set.
Task 4: Set up data for the cross tab
In this procedure, you set up the following items:
A data group, or dimension, containing values to use as the cross tab’s row headings
A data group, or dimension, containing values to use as the cross tab’s column headings
A summary field, or measure, providing aggregate values to use in the cells of the cross tab
Data that you set up for a cross tab is stored in an entity called a cube.
1 In Data Explorer, right-click Data Cubes, and choose New Data Cube.
2 In Data Cube Builder, specify the following information:
In Name, type:
Sales Cube
In Primary dataset, select Sales.
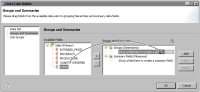
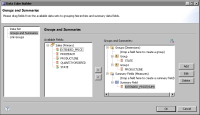
3 Choose Groups and Summaries.
4 In Available Fields, expand Sales. Drag STATE and drop it on the following location, as shown in Figure 24‑4:
(Drop a field here to create a group)
Figure 24‑4 Adding a state group to the cube
5 In Add Group, use the default group name. Choose OK.
6 Drag PRODUCTLINE from Available Fields and drop it on the following location:
(Drop a field here to create a group)
7 Use the default group name.
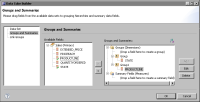
Data Cube Builder shows the STATE and PRODUCTLINE dimensions you created, as shown in Figure 24‑5.
Figure 24‑5 Data Cube Builder displaying two groups
8 Drag EXTENDED_PRICE from Available Fields and drop it on the following location:
(Drop a field here to create a summary field)
EXTENDED_PRICE(SUM) appears under Summary Field. SUM indicates that the SUM aggregate function is used to calculate the totals of the EXTENDED_PRICE values. The cube builder selects the SUM function by default. You can, however, select a different function to apply to a measure by selecting the measure, then choosing Edit.
Figure 24‑6 shows the dimensions and measure you defined.
Figure 24‑6 Data Cube Builder displaying two groups and a summary field
9 Choose OK to save the cube. The Sales cube appears under Data Cubes in Data Explorer.
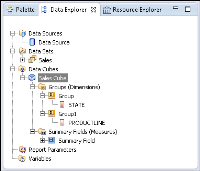
10 Expand the Sales Cube to view its contents, as shown in Figure 24‑7.
Figure 24‑7 Data Explorer showing the Sales cube
Task 5: Add a cross tab to the report
In this procedure, you add a cross tab to the report, then you insert data from the cube into the cross tab.
1 Choose the palette, then drag a cross tab element from the palette to the report. A cross tab appears in the report.
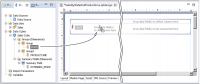
2 Choose Data Explorer. Under the first group in the Sales cube, drag STATE and drop it in the cross tab area that displays the following text:
Drop data field(s) to define rows here
Figure 24‑8 shows inserting STATE in this location.
Figure 24‑8 Inserting STATE data in the cross tab
3 From the Sales cube, under Group1, drag PRODUCTLINE and drop it in the cross tab area that displays the following text:
Drop data field(s) to define columns here
4 From the Sales cube, under Summary Field, drag EXTENDED_PRICE and drop it in the cross tab area that displays the following text:
Drop data field(s) to be summarized here
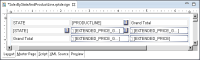
5 Using the property editor, select Hide Measure Header for the cross tab.
The cross tab should look like the one shown in Figure 24‑9.
Figure 24‑9 Cross tab design
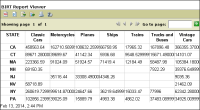
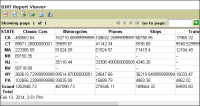
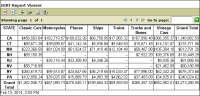
6 Preview the report. Figure 24‑10 shows a portion of the data that the cross tab displays.
Figure 24‑10 Preview of the cross tab data
The row headings display the states, the column headings display product lines, and the cells display the sales totals. The first cell displays 458563.64, which is the sales total of classic cars sold in California.
Task 6: Add grand totals
Each number displayed in the cross tab represents the sales total of a particular product for a particular state. In this procedure, you add grand totals to display the total sales of all products for each state, the total sales of each product, and the total of all sales across products and states.
1 Choose Layout to resume editing the cross tab.
2 Select the cross tab, if necessary, by clicking on the tab in the lower left corner of the cross tab. Make sure you select the entire cross tab, not just a part of it.
3 In Property Editor, choose the Row Area tab.
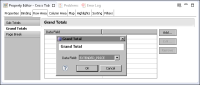
4 Choose Grand Totals, then choose Add.
5 In Grand Total, shown in Figure 24‑11, use the default values, then choose OK.
Figure 24‑11 Creating grand totals in the cross tab row area
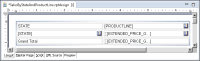
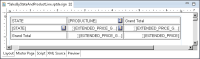
A new row is added to the bottom of the cross tab, as shown in Figure 24‑12. In this row is a label that displays Grand Total and a data element that displays [EXTENDED_PRICE].
Figure 24‑12 Cross tab including a new row to display grand totals
6 In Property Editor, choose the Column Area tab.
7 Choose Grand Totals, then choose Add.
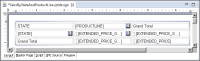
8 In Grand Total, use the default values, then choose OK. A new column is added to the cross tab, as shown in Figure 24‑13.
Figure 24‑13 Cross tab with a new column to display grand totals
9 Preview the report. Grand totals appear in the last row and last column of the cross tab.
Task 7: Format the cross tab
Now that the cross tab displays the correct data, you can focus on improving the presentation of data in the cross tab. You perform the following tasks in this section:
The default report layout preference, Fixed Layout, displays a cross tab with columns of equal size within a display area determined by the page size and margins set in the master page. In the report preview, notice that the EXTENDED_PRICE labels and some of the numbers are truncated.
To avoid losing content, you can do one of the following:
Change the page orientation from portrait to landscape.
Increase the page width.
If designing for HTML output, specify that the report width expand automatically to fit the data.
The following procedure uses the third option.
1 Choose Layout to resume editing the cross tab.
2 In the layout editor, click on an empty area of the report page.
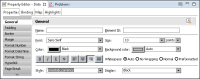
3 In Property Editor, under Properties, choose General.
4 Set Layout Preference to Auto Layout.
5 Preview the report. Figure 24‑14 shows a portion of the data that the cross tab displays. Each column in the cross tab expands to accommodate its content.
Figure 24‑14 Preview of the cross tab when the layout preference is set to Auto Layout
Note that this auto-expand feature applies only to HTML output. In other output formats, the size of the cross tab is always constrained by the page dimensions.
Display a string in empty cells
If there are no sales for a particular product in a particular state, the cell displays nothing. Because an empty cell can be interpreted as missing data, you can display a string, such as 0.00 or --, to indicate that the value is zero.
1 Choose Layout to resume editing the cross tab.
2 Select the cross tab by clicking on the tab in the lower left corner of the cross tab.
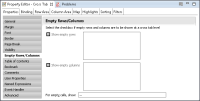
3 In Property Editor, choose Properties, then choose Empty Rows/Columns.
4 In the “For empty cells, show:” field, type the following text:
--
Figure 24‑15 shows the Empty Rows/Columns properties.
Figure 24‑15 Empty Rows/Columns properties of the cross tab
5 Preview the report. Cells that were previously empty now display --, as shown in Figure 24‑16.
Figure 24‑16 Preview of the cross tab showing -- to indicate no data
Change the format of the numbers
To indicate that the numbers displayed in the cross tab are dollar amounts, use the currency format. It is also easier to read the numbers if they are aligned to the right.
1 Choose Layout to resume editing the cross tab.
2 Right-click in an empty area on the report page, and choose Style➛New Style.
3 In Custom Style, type the following name for the new style:
crosstab_currency
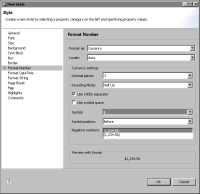
4 Specify a currency format, using the following steps:
1 Choose Format Number from the list of property categories.
2 In Format As, select Currency from the drop-down list.
3 In Currency Settings, specify the following values:
Set Decimal places to 2.
Select Use 1000s separator.
In Symbol, select $.
Use the default values for the other currency settings.
7 Preview the report to verify the formatting change.
Use darker lines around the cross tab and the cells
BIRT uses two predefined styles, crosstab and crosstab-cell, to set the default appearance of the overall cross tab and the cells, respectively. To change any of the cross tab or cell formats, such as the width or color of borders, edit these styles.
1 Choose Layout to resume editing the cross tab.
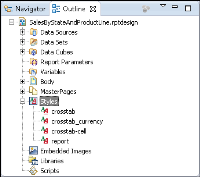
2 Choose the Outline view, located next to Navigator.
3 Expand the Styles item to show the crosstab and crosstab-cell styles, as shown in Figure 24‑20.
Figure 24‑20 Outline view displaying the cross tab styles
4 Right-click the crosstab style, then choose Edit Style.
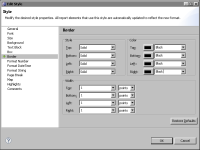
5 In Edit Style, choose Border. The colors of the borders are set to Gray.
6 Change the color of all the borders to Black, as shown in Figure 24‑21.
Figure 24‑21 Border colors set to Black
7 Choose OK to save your change to the crosstab style.
8 In Outline, right-click the crosstab-cell style, then choose Edit Style.
9 In Edit Style, choose Border.
10 Change the color of all the borders to Black. Choose OK.
In the layout editor, the lines around the cells and around the cross tab appear in black, as shown in Figure 24‑22.
Figure 24‑22 Cross tab design showing black borders
11 Preview the report. Figure 24‑23 shows a portion of the generated cross tab.
Figure 24‑23 Preview of the finished cross tab
You just learned how to build a basic cross tab that displays data from three fields. The rest of this section shows how to build more complex cross tabs.