The procedure for creating a filter condition is the same whether you create it at the data set, report element, or group level. The difference is how you access the filter tool.
When creating a filter condition, you specify the following information:
The expression to evaluate, typically a single field, such as row["grade"]
The operator that specifies the type of filter test, such as Equal to
The value for which to search, such as "A"
You can create more complex filter conditions that include JavaScript functions or scripts. For example, you can specify computed values for the expression and value portions of the filter. The following example shows a multiline expression in the expression part. The expression returns a customer’s first name from the customerName field, which stores full names.
If you combine this expression with the Equal to operator and specify a value of "John", the filter condition extracts the first name from the customerName field, compares the first name to John, and returns only rows where this condition is true.
The expressions and values that you specify in a BIRT filter condition must use JavaScript syntax, unless you use the Like operator. As described in Table 12‑2 in the previous section, when specifying a value for a filter condition that uses the Like operator, specify a string pattern that uses SQL syntax.
If you filter data using both the SQL query and BIRT Report Designer’s filter tool, be careful not to confuse SQL syntax with JavaScript syntax when specifying the filter condition. For example, it is easy to confuse the use of single quotation marks (' ') and double quotation marks (" "). SQL requires single quotation marks for string and date constants, but JavaScript requires double quotation marks. Another example is the comparison operator. Use = for SQL and == for JavaScript.
How to filter at the data set level
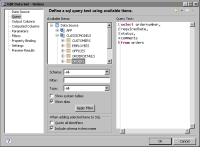
1 In Data Explorer, right-click the data set from which to filter rows, then choose Edit. Edit Data Set displays the query for the data set, as shown in Figure 12‑7.
Figure 12‑7 Edit Data Set displaying the query
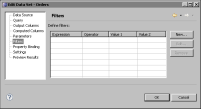
2 Choose Filters from the left side of the window. Edit Data Set displays filter information, as shown in Figure 12‑8.
Figure 12‑8 Edit Data Set displaying filtering information
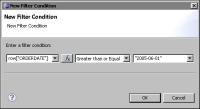
3 Choose New to create a filter condition.
4 In New Filter Condition, specify the following values:
In the first field, select a field from the drop-down list. Alternatively, open the expression builder to create a more complex expression.
In the second field, select an operator from the drop-down list.
In the third field, specify the value to search. Type the value, select from the list of values, or use the expression builder to create a more complex value expression. If you select the Is True, Is False, Is Null, or Is Not Null operator, a value is not required.
In the fourth field, which appears only if you select the Between or Not Between operator, specify a value. Figure 12‑9 shows an example of a filter condition.
Figure 12‑9 New Filter displaying a filter condition
Choose OK to save the new filter condition.
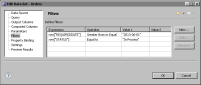
5 To create additional filter conditions for the data set, repeat steps 3 and 4. Figure 12‑10 shows two examples of filter conditions created for a data set. Figure 12‑11 shows the rows that the data set returns.
Figure 12‑10 Edit Data Set displaying the filter conditions for the data set
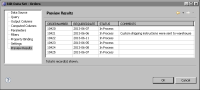
6 Choose Preview Results to verify the results that filtering the data set returns. If you specified multiple filter conditions, the data set returns only rows that match all filter conditions, as shown in Figure 12‑11. To return rows that match any one of the filter conditions, create a single filter condition that contains an OR expression, then select the Is True operator. This task is described later in this section.
Figure 12‑11 Preview Results shows only rows that meet both filter conditions
How to filter at the report element level
These instructions assume you already created a report that uses an element to display data from a data set.
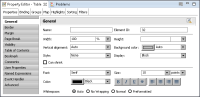
1 In the layout editor, select the table, cross tab, chart, or list from which to filter data. Property Editor displays the properties of the selected element, as shown in Figure 12‑12.
Figure 12‑12 Table properties
2 In Property Editor, choose the Filters tab. Property Editor displays the Filters page.
3 Choose Add to create a filter condition.
4 In New Filter Condition, specify the filter condition, then choose OK. For detailed steps, see the previous section.
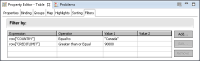
5 Figure 12‑13 shows some examples of filter conditions specified for a table.
Figure 12‑13 Filter conditions for a table
6 Preview the report to verify the results. If you specified multiple filter conditions, the report displays only rows that match all filter conditions.
How to filter at the group level
These instructions assume that you have already created a table that displays data from a data set, and created a group or groups to organize the data.
1 In the layout editor, select the table that contains the data to filter.
2 In Property Editor, choose the Groups tab. Property Editor displays the groups that you defined for the table.
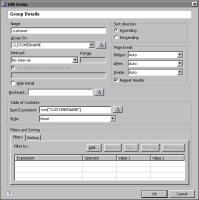
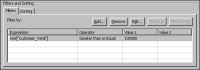
3 Double-click the group for which you want to filter data. Edit Group displays the properties of the group. Figure 12‑14 shows an example.
Figure 12‑14 Edit Group
4 Under Filters and Sorting, choose the Filters tab.
5 Choose Add to create a filter condition.
6 In New Filter Condition, specify the filter condition, then choose OK. Figure 12‑15 shows an example of a filter condition defined for a group.
Figure 12‑15 Filter condition for a group
7 Choose OK.
8 Preview the report to verify the results. The report displays a different set of group values.