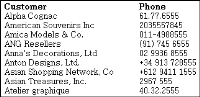
Use a table to display dynamic data in a row-and-column format. Dynamic data is data from a data source, such as a database or XML document. The data is dynamic because the values are not fixed in the report design. Instead, when the report runs, the report connects to the data source, retrieves the specified data, and displays the current data. Figure 6‑7 shows an example table that displays customer names and phone numbers from a data source.
Figure 6‑7 Table data in a generated report
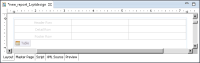
When you place a table on the page, the layout editor displays a row‑and‑column structure, such as the one shown in Figure 6‑8.
Figure 6‑8 Row-and-column structure of a table
Like the grid, the table layout automates the task of aligning report elements. Unlike the grid, the table iterates through all the data rows that a data set returns to display the dynamic list of data.
Note that a table can display data from one data set only. When you create a data set, ensure that it returns all the data that you want to display in a table. If the data that you need is stored in two database tables, write a query that joins the two tables. Alternatively, create two data sets and use two tables, one table for each data set.
Deciding where to place elements in a table
The table contains three types of rows in which you place report elements. Table 6-2 describes the types of information that you typically place in each row.
Table 6-2 Table row descriptions
Table row
Description
Header
Elements that you place in the header row appear at the beginning of the table. If the data in the table appears on multiple pages, the contents of the header appear at the top of every page. You can display the header contents only once, at the beginning of the table, by turning off the table’s Repeat Header property.
Place elements in the header to display the following:
A title
Column headings, such as Customer Name, Address, and Phone, above the data in a customer list
Summary information, such as the number of customers in the list
Detail
Elements that you place in the detail row represent the dynamic data in the table. The detail row displays each row from the data set. For example, display the main data, such as customer names, addresses, and phone numbers, in a customer list.
Footer
Elements that you place in the footer row appear once, at the end of the table. For example, display summary information, such as totals.
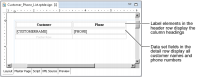
Figure 6‑9 shows a table layout for displaying a list of customer names and their phone numbers. The finished report displays the list that appears in Figure 6‑7.
Figure 6‑9 Table layout for customer names and phone numbers
Binding a table to a data set
When you place a data set field in a table, BIRT Report Designer:
Binds, or associates, the data set with the table. By binding these items, the table has the information that it needs to iterate through the data rows that the data set returns.
Creates a column binding, which binds the data set field with a named column.
Creates a data element that uses the column binding to display data from the data set field.
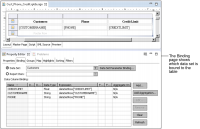
You can view this binding information on the table’s Binding properties page. To access this information, select the table, then choose the Binding tab at the top of Property Editor. Figure 6‑10 shows the Binding properties page.
Figure 6‑10 Property Editor’s Binding page for a selected table
You can also use this page to bind a table manually to a data set. The easier approach, however, is to place a data set field in the table and let BIRT Report Designer do the binding. If you are not placing data set fields in the table, but are inserting other types of elements, such as dynamic text elements or image elements that need to access data set data, then you need to manually bind the data set to the table before inserting those elements in the table.
A table can be bound to only one data set. BIRT Report Designer prevents you from inserting a field from a different data set. If you change the data set binding after you place fields in the table, you need to delete the fields because the table no longer has information about them.
If you do not change the data set binding, and you delete all the fields from a table, the table maintains its binding to the data set. To insert fields from a different data set into a table, you need to change the table’s data set binding first. Deleting all the fields from the previous data set does not remove the original binding.
How to bind a data set to a table
1 In the layout editor, hover the mouse pointer over the bottom left corner of the table until the Table tab appears, then choose the tab.
2 Choose the Binding tab at the top of Property Editor. The Data Set field shows either the name of the data set that is currently bound to the table or None if no data set is bound to the table.
3 From the Data Set drop-down list, select a data set. BIRT Report Designer binds the data set to the table. It also creates a column binding for each data set field. Elements placed in the table can now access all the fields in the data set.
Adjusting table rows and columns
You can add, delete, and resize rows and columns in the table as necessary, in the same way that you add, delete, and resize grid rows and columns. These tasks are described earlier in this section.
A table can contain any number of header, detail, and footer rows. For example, you can add two header rows, one to display summary information and the other to display column headings.
You can suppress duplicate values that occur one after the other in a table column. Select the column and then select Suppress Duplicates in Properties—General. Only the first occurrence of a duplicated value appears.