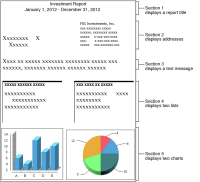
Like most documents, reports tend to be very structured. A report typically consists of distinct sections or a series of content blocks, as shown in Figure 6‑1. BIRT Report Designer provides an intuitive way to lay out a report. A visual layout editor displays a page to which you add content, such as data fields, charts, pictures, or text blocks, in each section of the report.
Figure 6‑1 Report sections
A section can consist of one or multiple elements. The first section of a report, for example, is typically the report title. This section might contain just one text element. Another section, which displays a list of customer records, might contain four data fields and four column headings. More complex sections can contain multiple subsections to display items such as multiple lists that appear side by side or a combination of lists, charts, and text blocks. A key concept to understand about sections is that each section is a horizontal block of content.
You lay out the contents of each section of a report in the same way that you read a report—start from the top of the report and go from left to right until the end of the report. By dividing a report into sections, you can manipulate each section independently. For example: