Cross tabs typically aggregate and display data by time periods because time is an essential part of data analysis. Any analysis of stock performance, revenue, or productivity is meaningful only if it can be measured by day, week, month, quarter, or year. In all the examples so far, cross tabs that contain a time dimension display data by a specific time period, for example, sales data for a particular quarter or year.
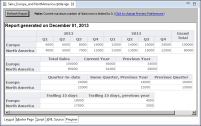
You can, however, design cross tabs to display data by relative time periods, such as current month, previous month, year-to-date, quarter-to-date, quarter-to-date in the previous year, trailing 30 days, and so on. Displaying data by relative time periods supports, for example, the comparison of current data with past data of the same period. Figure 24‑65 shows a report that displays sales data in four cross tabs. All the cross tabs use data from the same cube.
The first cross tab displays sales by region and by year and quarter.
The second cross tab displays total sales, sales in the current year (2013), and sales in the previous year (2012).
The third cross tab displays the quarter-to-date sales in the current year and, as comparison, sales for the same period in the previous year, and sales in the previous quarter.
The fourth cross tab compares sales in the previous 15 days with the same period the previous year.
Figure 24‑65 Report displaying four cross tabs
The first cross tab represents the typical way of displaying a measure (sales) by two dimensions (a region dimension and a time dimension) defined in a cube. The other cross tabs aggregate data by region and by relative time periods. The procedures for aggregating the sales data by the relative time periods shown in the examples are described later.
As the cross tab examples in Figure 24‑65 show, the capability to aggregate data by relative time periods is useful for comparing data across different time periods. In addition to viewing data by the typical time periods, such as quarter‑to‑date or previous quarter, you can define time periods, for example, to compare the week before Christmas with the week after Christmas, or the last 15 days in a quarter with the same period last year.
BIRT provides this functionality at the cross tab level where you add a relative time period element and select the time period (Year To Date, Previous Year To Date, and so on) for which to view data. In many cases, you do not need to make any changes to the cube, assuming that the cube already contains at least one time dimension, which is typical. A cube that provides sales data, for example, typically defines time dimensions, such as orderDate or shipDate.
How to aggregate data by a relative time period
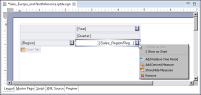
1 In the detail area of a cross tab, insert a relative time period element. To do so, click the button next to a measure, as shown in Figure 24‑66, and choose Add Relative Time Period.
Figure 24‑66 Inserting a relative time period measure
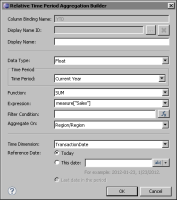
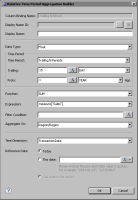
2 In Relative Time Period Aggregation Builder, specify the properties of the relative time period measure. All properties are required unless described as optional.
In Column Binding Name, type a name for the measure data element.
In Display Name (optional), type an alternate name to display in the report design. If one is not specified, the report design displays the Column Binding Name value.
In Data Type, select a data type appropriate for the measure. The default type, Float, provides the best performance and a high precision level.
In Time Period, select the desired time period in which to aggregate the data. For example, to calculate sales totals for the current month, select Current Month. The time periods are described in Table 24‑1. Some time periods, such as Previous N Months, require additional property values, which appear immediately below Time Period.
In Function, select the function to perform the desired aggregate calculation. The default function, SUM, adds up all the measure values. For information about each aggregate function, see Aggregating data.
In Expression, select the measure whose values to aggregate, or specify an expression. The drop-down list displays the measures used in the cross tab.
In Filter Condition (optional), specify an expression to include only certain measure values from the aggregate calculation. For example, specify a filter, such as measure["SalesAmount"] > 100, to include only sales amounts over 100 in the calculation.
In Aggregate On, select the dimension or dimensions by which to aggregate the measure data. The dimensions used in the cross tab are selected by default.
In Time Dimension, select the time dimension that contains the date values to use in the relative time period calculation. The drop-down list displays all the time dimensions defined in the cube. The time dimension inserted in the cross tab, if any, is selected by default. If you did not insert a time dimension in the cross tab, the first time dimension defined in the cube is selected by default. In the example report shown in Figure 24‑65, the first cross tab displays a time dimension (dates are grouped by year and quarter), but the other cross tabs do not.
In Reference Date, specify the date that is the basis for calculating the specific period for aggregating data. Select one of the following options:
Today. This option uses the current date (the date on which the report is run) as the reference date. For example, if the relative time period specified in Time Period is Year to Date, and the report is run on 12/01/2013, BIRT aggregates the data for the year up to, and including, 12/01/2013.
This date. This option uses a fixed date value, which you specify, as the reference date. If the time period is Year to Date, and you specify 09/30/2013, BIRT aggregates the data for the year up to, and including, 09/30/2013. You can use the Calender tool in the expression builder to select a date, or type a date value in one of the following formats:
"09/30/2013"
"2013-09-30"
Enclose the date in quotes if specifying a JavaScript or EasyScript expression.
Last date in Time Dimension. This option uses the latest date in the dimension specified in the Time Dimension property as the reference date. For example, if the time dimension contains the dates 07/07/2013, 11/30/2013, and 09/19/2013, the date 11/30/2013 is used as the reference date. This option is available only if the cross tab contains a time dimension.
Examples of relative time period aggregations
Figure 24‑65 showed examples of cross tab data aggregated by relative time periods. In all the examples, the current date is December 01, 2013. This section describes how those aggregations are defined.
Example 1: Displaying data for the current year
Figure 24‑67 shows using Current Year to calculate the sum of the Sales measure by region for the current year up to the current date. The dates used in the calculation are from the TransactionDate dimension. These settings result in the current year data displayed in the second cross tab shown in Figure 24‑65.
Figure 24‑67 Properties set to display Sales data for the current year
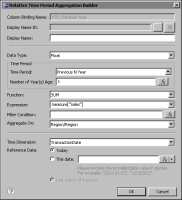
Example 2: Displaying data for the previous year
Figure 24‑68 shows using Previous Year to calculate the sum of the Sales measure by region for the previous year. Number of Year(s) Ago is set to 1 to specify that data from one year ago is to be used in the calculation. Reference Date set to Today specifies that the previous one year is calculated from the current date. These settings result in the previous year data displayed in the second cross tab shown in Figure 24‑65.
Figure 24‑68 Properties set to display Sales data for the previous year
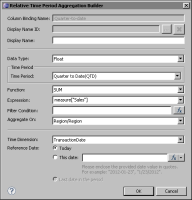
Example 3: Displaying data for the quarter to date
Figure 24‑69 shows using Quarter to Date to calculate the sum of the Sales measure by region for the current quarter up to the current date. These settings result in the quarter-to-date data displayed in the third cross tab shown in Figure 24‑65.
Figure 24‑69 Properties set to display Sales data for the quarter to date
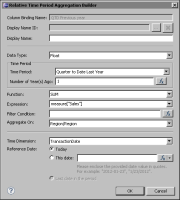
Example 4: Displaying data for the same quarter in the previous year
Figure 24‑70 shows using Quarter to Date Last Year to calculate the sum of the Sales measure by region for the same quarter last year. Number of Year(s) Ago is set to 1 to specify that data for the quarter from one year ago is to be used in the calculation. These settings result in the same quarter, previous year data displayed in the third cross tab shown in Figure 24‑65.
Figure 24‑70 Properties set to display Sales data for the same quarter last year
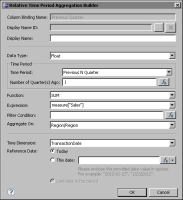
Example 5: Displaying data for the previous quarter
Figure 24‑71 shows using Previous Quarter to calculate the sum of the Sales measure by region for the previous quarter. Number of Quarter(s) Ago is set to 1 to specify that data from one quarter ago is to be used in the calculation. These settings result in the previous quarter data displayed in the third cross tab shown in Figure 24‑65.
Figure 24‑71 Properties set to display Sales data for the previous quarter
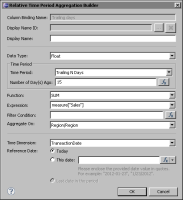
Example 6: Displaying data for the previous 15 days
Figure 24‑72 shows using Trailing N Days to calculate the sum of the Sales measure by region for a specified number of days prior to the current day. Number of Day(s) Ago is set to 15 to specify that data from the previous 15 days is to be used in the calculation. These settings result in the trailing 15 days data displayed in the fourth cross tab shown in Figure 24‑65.
Figure 24‑72 Properties set to display Sales data for the previous 15 days
Example 7: Displaying data for the previous 15 days last year
Figure 24‑73 shows using Trailing N Periods to calculate the sum of the Sales measure by region for a specified number of days prior to the current day, but in the previous year. The first Number of Period Ago property is set to 15 and The First Period is set to DAY to specify that data from the previous 15 days is to be used in the calculation. The second Number of Period Ago property is set to 1 and The Second Period is set to YEAR to specify that the calculation is for the previous year. These settings result in the trailing 15 days, previous year data displayed in the fourth cross tab shown in Figure 24‑65.
Figure 24‑73 Properties set to display Sales data for the previous 15 days last year
Supported time periods
Table 24‑1 describes the time periods available for the Time Period property. All the time periods are relative to a reference date, which, as described earlier, can be the current date (the date the report is run), a date you specify, or the latest date in the time dimension.
Table 24‑1 Supported time periods
Time period
Description
Current Month
The entire month relative to the month and year portions of the reference date. For example, if the reference date is 2012-01-10, the period is 2012-01-01 to 2012-01-31.
Current Period
The entire period from a specified period relative to the reference date. For example, use to aggregate data for the same quarter five years ago.
This time period requires three additional properties:
The First Period, which specifies either year, quarter, or month as the type of period for which to aggregate data
Number of Periods Ago, which specifies the number of prior periods (type of period specified next), from which to begin the calculation
The Second Period, which specifies either year, quarter, month, or day as the type of period
For example, if the reference date is 2012-02-08, to aggregate data for the same quarter five years ago, specify the following:
The First Period: Quarter
Number of Periods Ago: 5
The Second Period: Year
Data is aggregated for the entire quarter, 2007-01-01 to 2007‑03‑31.
Current Quarter
The entire quarter relative to the month and year portions of the reference date. For example, if the reference date is 2012-12-15, the period is 2012-10-01 to 2012-12-31.
Current Year
The entire year relative to the year portion of the reference date. For example, if the reference date is 2012-06-30, the period is 2012-01-01 to 2012-12-31.
Month to Date
The period starting at the beginning of the reference date’s month and ending at the reference date. For example, if the reference date is 2012-12-25, the period is 2012-12-01 to 2012‑12‑25.
Month to Date Last Year
Same as Month To Date, but for the previous nth year. This time period requires another property, Number of Years Ago, which specifies which prior year. For example, if the reference date is 2012-12-25 and Number of Years Ago is 1, the period is 2011‑12‑01 to 2011-12-25.
Next N Periods
The next n periods from the reference date. This time period requires two additional properties:
Number of Periods Ago, which specifies the number of periods
The First Period, which specifies either year, quarter, month, week, or day as the period in which to begin the calculation
For example, if the reference date is 2012-01-01, Number of Periods Ago is 1, and The First Period is Month, then the period is 2012-01-01 to 2012-01-31.
Period to Date
The period from a specified period relative to the reference date. For example, use to aggregate data for the same quarter to date, five years ago.
This time period requires three additional properties:
The First Period, which specifies either year, quarter, or month as the type of period for which to aggregate data
Number of Periods Ago, which specifies the number of prior periods (type of period specified next), from which to begin the calculation
The Second Period, which specifies either year, quarter, month, or day
For example, if the reference date is 2012-02-08, to aggregate data for the same quarter up to 02-08, five years ago, specify the following:
The First Period: Quarter
Number of Periods Ago: 5
The Second Period: Year
Data is aggregated for 2007-01-01 to 2007-02-08.
Previous N Month
The previous nth month relative to the month and year portions of the reference date (the day portion is ignored). This time period requires another property, Number of Months Ago, which specifies which prior month. For example, to specify three months back from the reference month, type 3. If the reference date is 2012‑01‑15 and Number of Months Ago is 3, then the period is 2011-10-01 to 2011-10-31.
Previous N Month to Date
The previous nth month relative to the reference date. This time period requires another property, Number of Months Ago, which specifies which prior month. For example, to specify three months back from the reference date, type 3. If the reference date is 2012‑01‑15 and Number of Months Ago is 3, then the period is 2011‑10-01 to 2011-10-15.
Previous N Quarter
The previous nth quarter relative to the month and year portions of the reference date (the day portion is ignored). This time period requires another property, Number of Quarters Ago, which specifies which prior quarter. For example, to specify one quarter back from the reference date, type 1. If the reference date is 2012‑03‑15 and Number of Quarters Ago is 1, then the period is 2011‑10‑01 to 2011‑12‑31.
Previous N Quarter to Date
The previous nth quarter relative to the reference date. This time period requires another property, Number of Quarters Ago, which specifies which prior quarter. For example, to specify one quarter back from the reference date, type 1. If the reference date is 2012‑03‑15 and Number of Quarters Ago is 1, then the period is 2011‑10‑01 to 2011‑12‑15.
Previous N Year
The previous nth year relative to the year portion of the reference date. This time period requires another property, Number of Years Ago, which specifies which prior year. For example, to specify two years back from the reference date, type 2. If the reference date is 2011‑09‑30 and Number of Years Ago is 2, then the period is 2009‑01‑01 to 2009‑12‑31.
Previous N Year to Date
The previous nth year relative to the reference date. This time period requires another property, Number of Years Ago, which specifies which prior year. For example, to specify two years back from the reference date, type 2. If the reference date is 2011‑09‑30 and Number of Years Ago is 2, then the period is 2009‑01‑01 to 2009‑09‑30.
Quarter to Date
The period starting at the beginning of the reference date’s quarter and ending at the reference date. For example, if the reference date is 2011‑12‑25, the period is 2011‑10‑01 to 2011‑12‑25.
Quarter to Date Last Year
Same as Quarter To Date, but for the previous nth year. This time period requires another property, Number of Years Ago, which specifies which prior year. For example, if the reference date is 2011‑12‑25 and Number of Years Ago is 1, then the period is 2010‑10‑01 to 2010‑12‑25.
Trailing N Days
The last n days from the reference date. This time period requires another property, Number of Days Ago, which specifies the number of trailing days. For example, if the reference date is 2011‑12‑25, and Number of Days Ago is 15, then the period is 2011‑12‑10 to 2011‑12‑24.
Trailing N Months
The last n months from the reference date. This time period requires another property, Number of Months Ago, which specifies the number of trailing months. For example, if the reference date is 2011‑12‑25, and Number of Months Ago is 3, then the period is 2011‑09‑25 to 2011‑12‑25.
Trailing N Periods
The last n periods from a specified period relative to the reference date. For example, use to aggregate data for the two months prior to the reference date five years ago.
This time period requires four additional properties. The first and second properties define the period for which to aggregate data:
Number of Periods Ago, which specifies the number of periods
The First Period, which specifies either year, quarter, month, or day as the type of period
The third and fourth properties define the period relative to the reference date from which to begin the calculation.
Number of Periods Ago, which specifies the number of prior periods
The Second Period, which specifies either year, quarter, month, or day as the type of period
For example, if the reference date is 2012‑01‑01, to aggregate data for the two months prior to January 1, five years ago, specify the following:
Number of Periods Ago: 2
The First Period: Month
Number of Periods Ago: 5
The Second Period: Year
Data is aggregated for the period 2007‑11‑01 to 2007‑12‑31.
Year to Date
The period starting at the beginning of the reference date’s year and ending at the reference date. For example, if the reference date is 2011‑06‑30, the period is 2011‑01‑01 to 2011‑06‑30.
Using the * to Date and Trailing N * time periods
Time periods, such as Month to Date, Quarter to Date, Previous N Year to Date, Trailing N Months, and Trailing N Periods, are calculated using the year, month, and day parts of a reference date. For example, Month to Date covers the period starting at the beginning of the reference date’s month and ending at the reference date. If the reference date is 2012‑01‑08, the period is 2012‑01‑01 to 2012‑01‑08. Contrast this with Current Month, which is calculated using only the year and month parts of a reference date. For a reference date of 2012‑01‑08, Current Month covers the entire month, 2012‑01‑01 to 2012‑01‑31.
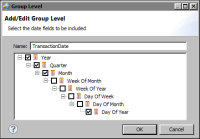
Because the * to Date and Trailing N * time periods use the day part of a reference date, the time dimension defined in the cube must include the Day Of Year level. Figure 24‑74 shows an example in which the time levels, Year, Quarter, Month, and Day Of Year, are selected for a time dimension.
Figure 24‑74 Time levels selected for a time dimension in a cube
If the time dimension in the cube does not include the Day of Year level, and you use a * to Date or a Trailing N * time period in a relative time period measure, BIRT displays an error message when you run the report. In the generated report, those measures display the wrong results. Month to Date returns the same results as Current Month, Quarter to Date returns the same results as Current Quarter, and so on. In other words, the day part of the reference date has no effect.