This tutorial provides instructions for grouping customer data by credit limit. It uses the report from Tutorial 1: “Building a simple listing report” in Learning the basics. The first tutorial shows how to build a simple report that lists customers in alphabetical order. This report builds on the first one and organizes customers into credit limit groups of $50,000.00, such as 0–49999, 50000–99999, 100000–149999, and so on.
In this tutorial, you perform the following tasks:
In the first tutorial, you created Customers.rptdesign in a project folder named My Reports. Open that report using one of the following procedures, depending on the designer you are using:
In BIRT Report Designer, open the file through Navigator, using the following steps:
1 If necessary, open Navigator by choosing Window➛Show View➛Navigator. Navigator shows all the project folders and report files you create.
2 Navigate to the My Reports folder, then double-click Customers.rptdesign.
In BIRT RCP Report Designer, use the main menu to open the file.
1 Choose File➛Open File.
2 Navigate to and select Customers.rptdesign, then choose Open.
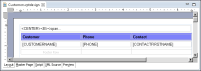
The file opens in the layout editor, as shown in Figure 9‑32.
Figure 9‑32 Customer report design in the layout editor
Task 2: Save the report as a new file
Rather than editing directly the report created in the first tutorial, save Customers.rptdesign as a new file. This approach ensures you have a file to return to if you have problems completing this tutorial.
1 Choose File➛Save As. Save As displays the file’s current name and location.
2 In File name, change Customers.rptdesign to Customers_grouped.rptdesign, then choose Finish. BIRT Report Designer makes a copy of Customers.rptdesign. The new report appears in the layout editor.
Task 3: Add the credit limit field to the data set
In order for the report to display credit limit data, add the CREDITLIMIT field to the data set.
1 Choose Data Explorer, expand Data Sets, then double-click Customers. Edit Data Set displays the SQL query for the Customers data set.
2 In the query, add a comma (,) after phone.
3 On the next line, add the following text:
creditLimit
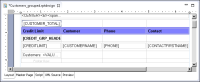
The modified query should look like the one shown in Figure 9‑33.
Figure 9‑33 Query showing creditLimit field added
4 Choose Preview Results to verify that the query returns rows that include credit limit information.
5 Choose OK to save the data set.
Task 4: Add credit limit data to the report
Use this procedure to insert the credit limit field in the existing table.
1 In the layout editor, select the table by selecting the Table tab. Guide cells appear at the top and left side of the table.
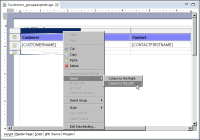
2 Right-click the guide cell above the first column, then choose Insert➛Column to the Left, as shown in Figure 9‑34.
Figure 9‑34 Inserting a column to the left of an existing column
A new column appears.
3 Drag the CREDITLIMIT field from Data Explorer, and drop it in the detail row cell next to [CUSTOMERNAME].
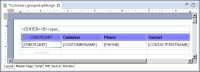
In the layout editor, the table displays the added field, as shown in Figure 9‑35. The table also shows the label element that the layout editor automatically added to the header row. This label serves as the column heading and displays the field name as static text.
4 Edit the CREDITLIMIT label so that it displaysCredit Limit.
Figure 9‑35 Result of adding the credit limit field in the layout editor
5 Format the Credit Limit label to look like the other labels in the table header.
1 Right-click the Customer label, and select Copy Format.
2 Right-click the Credit Limit label, and select Paste Format.
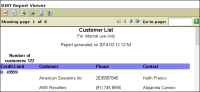
6 Preview the report. The report should look like the one shown in Figure 9‑36.
Figure 9‑36 Report preview showing the result of adding credit limit
Some of the customers have a credit limit of 0. These are new customers who have not yet been approved for a line of credit.
Task 5: Group customer data by credit limit
The report is currently sorted alphabetically by customer name. Recall that in the first tutorial, you specified that the rows in the table be sorted by customer name. In this procedure, you group the data by credit limit in intervals of 50,000. When grouping data, BIRT sorts the rows into groups first, then it sorts the rows within each group, assuming that there is a sort condition specified at the table level. Completing this task sorts the data rows within each credit limit group by customer name.
1 Choose Layout to return to the layout editor.
2 Right-click the Table tab, and choose Insert Group➛Above.
3 In New Group, follow these steps to specify grouping by credit limit in intervals of 50,000:
1 In Name, type the following text:
credit_group
2 In Group On, select CREDITLIMIT from the drop-down list.
3 In Interval, select Interval from the drop-down list.
4 In Range, type 50000.
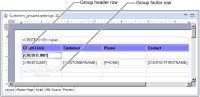
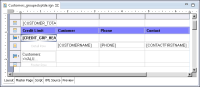
5 Use the default values for the other options. Choose OK. The table in the report design displays a group header and a group footer row, as shown in Figure 9‑37. The table also shows the data element that the layout editor automatically added to the group header row. This data element serves as the group heading and, in the generated report, displays the first credit limit value of each group.
Figure 9‑37 Group header and group footer rows in a report design
4 Select the [CREDITLIMIT] data element in the group header row. Do not select the [CREDITLIMIT] data element in the detail row.
5 In Property Editor, under Properties, in General, choose the B button to format the group heading as bold text.
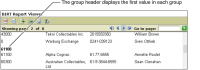
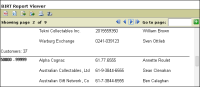
6 Preview the report. Page through the report to view all the data. The report organizes data into four credit limit groups. At the beginning of each group, the following numbers appear in bold: 0, 61100, 113000, 227600. These numbers match the first credit limit value of each group. Within each group, customer names are sorted in alphabetical order. Figure 9‑38 shows one of the four credit limit groups.
Figure 9‑38 Report preview showing one of the four credit limit groups
Task 6: Display credit limit ranges in the group header
Rather than display the first value of each group in the group header, the report is easier to navigate if it displays the credit limit range for each group, as follows:
0 - 49999
50000 - 99999
100000 - 149999
This procedure shows how to write a JavaScript expression to display these credit limit ranges. The procedure also shows how to create a column binding with which to associate the JavaScript expression.
1 Choose Layout to return to the layout editor.
2 Delete the [CREDITLIMIT] data element in the group header.
3 Insert a new data element in its place by right-clicking the cell and choosing Insert➛Data. New Data Binding prompts you to create a column binding for the new data element.
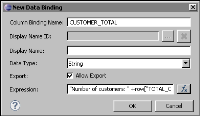
4 Specify a name and expression for the column binding. Use the default data type, String.
1 In Column Binding Name, type the following name:
CREDIT_GRP_HEADER
2 Open the expression builder to write a JavaScript expression.
3 In the expression builder, type the following expression:
for(i=50000; i<300000; i+=50000){
if( row["CREDITLIMIT"] < i ){
rangeStart = i-50000;
rangeEnd = i-1;
break;
}
}
displayString = rangeStart + " - " + rangeEnd;
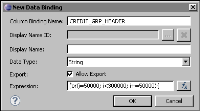
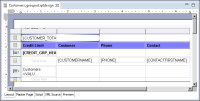
Choose OK. The expression appears in the Expression field in New Data Binding, as shown in Figure 9‑39.
Figure 9‑39 Column binding defined
4 Choose OK to save the column binding for the data element. In the layout editor, the data element displays the column binding name, [CREDIT_GRP_HEADER].
5 Select the data element. In Property Editor, under Properties, in General, choose B to format the group heading as bold text.
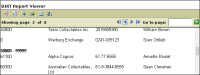
6 Preview the report. The group headers display the credit limit ranges. Figure 9‑40 shows the 50000 - 99999 group header.
Figure 9‑40 Report showing credit limit ranges
Task 7: Display aggregate information
One of the benefits of grouping data is that you can add summary information at the beginning or end of each group. Summary information is also known as aggregate information. In this procedure, add the following aggregate information to the report:
The number of customers in each group
The number of all customers listed in the report
Display the number of customers in each group
1 Choose Layout to return to the layout editor.
2 In the palette, under Quick Tools, drag an aggregation element and drop it in the second cell in the group footer row. Elements that are in the group footer appear at the end of every group.
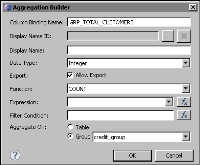
3 In Aggregation Builder, specify the following values:
1 In Column Binding Name, type the following name:
GRP_TOTAL_CUSTOMERS
2 In Function, select COUNT. BIRT selects the appropriate data type, Integer.
3 In Aggregate On, select Group and credit_group. This value indicates that the COUNT function returns the number of rows in each credit limit group.
Figure 9‑41 shows the complete definition for the aggregation element.
Figure 9‑41 Aggregation Builder displaying values for getting the count of customers in each credit limit group
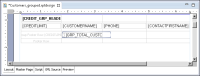
4 Choose OK. In the report design, shown in Figure 9‑42, the aggregation element displays the sigma symbol followed by the column binding name.
[GRP_TOTAL_CUSTOMER]
Figure 9‑42 Report design displaying the aggregation element
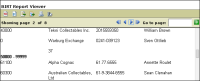
4 Preview the report. The report displays the number of customers at the end of each group. Figure 9‑43 shows the number of customers, 37, for the first credit limit group.
Figure 9‑43 Report showing a count for each group
5 Choose Layout to return to the layout editor.
6 Instead of displaying just the number of customers in each group, display the following text before the total:
Customers:
1 Drag a text element from the palette, and drop it in the first cell in the group footer row.
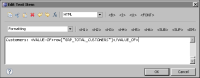
2 In Edit Text Item, select HTML from the drop-down list that displays Auto.
3 Specify the following text in the text area, shown in Figure 9‑44:
In a text element, the <VALUE-OF> tag supports the display of dynamic data. The expression, row["GRP_TOTAL_CUSTOMERS"], is a reference to the column binding you created to return the number of customers in each credit limit group.
Figure 9‑44 Text specified for the text element
4 Choose OK to save the edits to the text element.
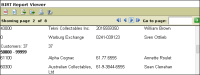
7 Preview the report.
8 Page down to the bottom of the first credit limit group. The report should look like the one shown in Figure 9‑45. The group footer displays the following information:
Customers: 37 37
Figure 9‑45 Report preview showing the text displayed by the text element
9 Choose Layout to return to the layout editor.
10 Delete the aggregation element from the second cell in the group footer row to remove the second total, which is now redundant.
Display the total number of customers in the report
In the previous procedure, you added aggregate data by inserting the aggregation element from the palette. This time, you add aggregate data by creating a column binding through the table’s Binding page.
1 Select the table.
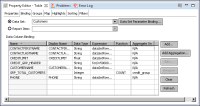
2 In Property Editor, choose the Binding tab. The Binding page, as shown in Figure 9‑46, displays all the column bindings used by elements in the table.
Figure 9‑46 Column bindings displayed
3 Choose Add Aggregation to create a new column binding that defines an aggregation.
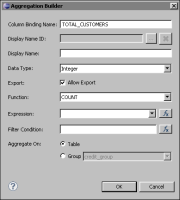
4 In Aggregation Builder, specify the following values:
1 In Column Binding Name, type the following name:
TOTAL_CUSTOMERS
2 In Function, select COUNT.
3 In Aggregate On, select Table. This value indicates that the COUNT function returns the number of rows in the table. Figure 9‑47 shows the complete definition for the aggregation element.
Figure 9‑47 Aggregation Builder displaying values for getting the count of customers in the table
4 Choose OK. The new column binding, TOTAL_CUSTOMERS, is available for use by any element in the table.
5 Select the table, if necessary. Guide cells appear at the top and left side of the table.
6 Right-click the guide cell on the left of the first row, Table ‑ Header, then choose Insert➛Row➛Above. A new table header row appears above the row that displays the column headings. The new row appears in color because it inherits the properties of the row below it.
7 Select the new row. In Property Editor, under Properties, in General, set Background color to white.
8 Drag a data element from the palette, and drop it in the first cell in the new table header row.
9 In New Data Binding, create a new column binding:
1 In Column Binding Name, type the following name:
CUSTOMER_TOTAL
2 In Data Type, use the default, String.
3 In Expression, choose the expression builder button.
4 In the expression builder:
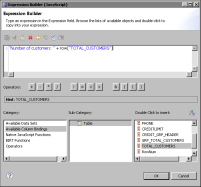
Type the following text:
"Number of customers: " +
In the lower pane of the expression builder, select Available Column Bindings, select Table, then double-click TOTAL_CUSTOMERS, the column binding you created to get the number of customers in the table. The expression, row["TOTAL_CUSTOMERS"] appears after the text you typed in the text area, as shown in Figure 9‑48.
Figure 9‑48 The expression builder displaying the expression that refers to the TOTAL_CUSTOMERS column binding
Choose OK. The expression appears in the Expression field on New Data Binding, shown in Figure 9‑49.
Figure 9‑49 Column binding defined
5 Choose OK to save the column binding. The report design should look like the one shown in Figure 9‑50.
Figure 9‑50 Report design showing a total count for customers
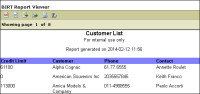
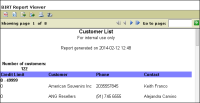
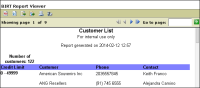
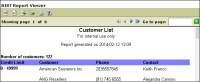
10 Preview the report. The report displays the number of customers at the beginning of the table, as shown in Figure 9‑51. The text is centered within the column. You re-format this text later.
Figure 9‑51 Report showing a total number of customers
Task 8: Format the report
Now that the report displays the correct data, focus on improving the report’s appearance. You perform the following tasks in this section:
When you insert a table, BIRT creates columns with equal widths. In this report, you can improve the layout by decreasing the width of the credit limit column, and increasing the width of the customer column.
1 Choose Layout to return to the layout editor.
2 Select the table.
3 Select the first column and decrease its width to 1.25 inches either by dragging the column boundary or setting its Width property.
By decreasing the width of the first column, the width of the second column increases.
4 Preview the report. The spacing of data is improved, as shown in Figure 9‑52.
Figure 9‑52 Report showing adjusted column widths
Remove credit limit data from the detail rows
To verify that data appears in the correct credit limit groups, it is useful to display each customer’s credit limit. Now that you have verified the data, delete the individual credit limit information from the report.
1 Choose Layout to return to the layout editor.
2 Delete the [CREDITLIMIT] data element from the detail row.
3 Preview the report. It should look like the one shown in Figure 9‑53.
Figure 9‑53 Report showing credit limit data removed for each row
Display group headings on the first row of each group
The credit limit group headings appear in their own rows, above the detail rows of each group. In this procedure, drop the group headings so that they appear in the first detail row of each group.
1 Choose Layout to return to the layout editor.
2 Select the cell that contains the group heading, as shown in Figure 9‑54. Be sure to select the cell and not the data element in the cell.
Figure 9‑54 Group heading cell selected
3 In the General properties of Property Editor, set Drop to Detail. In the report design, the group heading still appears above the detail row because technically the element is still in the group header row.
4 Preview the report. The group headings appear in the first row of each group, as shown in Figure 9‑55.
Figure 9‑55 Report showing dropped group headings
Separate each group with a line
Drawing a line to separate each group makes it easier to see each data group.
1 Choose Layout to return to the layout editor.
2 Select all the cells in the group footer row. To select multiple cells, press the Shift key as you click each cell.
3 In Property Editor, under Properties, choose Border, then set the border properties, as follows:
Set Style to a solid line.
Set Color to Black.
Set Width to Thin.
Choose the button that shows the bottom border.
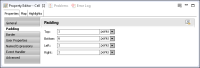
4 Add more space between the line and text above it. While the cells are still selected, choose the Padding properties in Property Editor, and set Bottom to 6.0 points, as shown in Figure 9‑56.
Figure 9‑56 Property Editor showing padding values for selected cells
5 Preview the report. A line appears at the end of each group, as shown in Figure 9‑57.
Figure 9‑57 Report showing a line between groups
Display the number of customers text on one line
The text at the top of the table appears centered within the first column. In this procedure, you format the text so that it appears left-aligned and on one line.
1 Choose Layout to return to the layout editor.
2 Using Shift-click, select the first and second cells in the top table header row, as shown in Figure 9‑58.
Figure 9‑58 Two cells in the top table header row selected
3 Right-click the selected cells, and choose Merge Cells.
4 Select the [CUSTOMER_TOTAL] element in the merged cell, and in the General properties of Property Editor, choose the B button and the Left button.
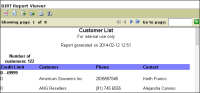
5 Preview the report. It should look like the one shown in Figure 9‑59.
Figure 9‑59 Report showing Number of customers: 122 on one line
Task 9: Display credit limit ranges in the table of contents
When a report contains groups, BIRT generates a table of contents, using the group values to show the hierarchy of the report. Rather than display the first value of each credit limit group, the table of contents makes more sense if it displays the same credit limit range values as the report. You accomplish this task by using the same JavaScript expression that you used previously to display credit limit ranges (0 ‑ 49999, 50000 ‑ 99999, and so on) in the group header.
1 Return to BIRT Report Designer.
2 In the layout editor, select the table, then choose the Groups tab in Property Editor.
3 Double-click credit_group in the list of groups.
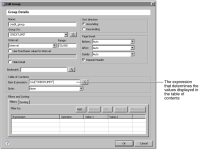
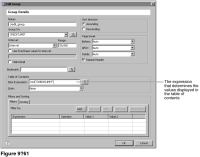
Edit Group, shown in Figure 9‑60, displays the properties of the group. Under Table of Contents, Item Expression is set, by default, to the grouping field, row["CREDITLIMIT"].
Figure 9‑60 Edit Group displaying the properties of credit_group
4 Choose the expression builder button, and, in the expression builder, replace the row["CREDITLIMIT"] expression with the following expression. This expression is the same column-binding expression that is used by the data element, [CREDIT_GRP_HEADER], in the group header. Rather than typing the expression again, you can copy it from the data element and paste it here.
for(i=50000; i<300000; i+=50000){
if( row["CREDITLIMIT"] < i ){
rangeStart = i-50000;
rangeEnd = i-1;
break;
}
}
displayString = rangeStart + " - " + rangeEnd;
Choose OK to save the expression.
5 Choose OK to save the edits to the group.
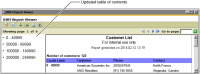
6 Preview the report to verify the change in the table of contents. The table of contents displays the credit limit ranges, as shown in Figure 9‑62.