Tutorial 7: Building a report containing side‑by‑side subreports
This section provides step-by-step instructions for building a report that displays a list of customers. For each customer, the report displays order and payment information. The order information and payment information are in separate, adjacent subreports. The customer report is the master report, which is also called the outer report. The orders and payments subreports are the detail reports, which are also called the inner reports.
Each report accesses data from a different table in the sample database, Classic Models, Inc. The customer report, orders subreport, and payment subreport use data from the Customers, Orders, and Payments tables, respectively.
A common field, CUSTOMERNUMBER, links the reports. The value of the linking field in the master report determines what data appears in the detail reports. For example, if the customer number in the master report is 173, the detail reports display the order and payment information for the customer whose ID is 173.
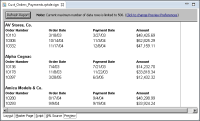
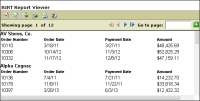
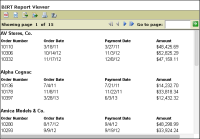
Figure 14‑8 shows a portion of the finished report.
Figure 14‑8 Customers master report including orders and payments subreports
In this tutorial, you perform the following tasks:
If you are using BIRT Report Designer, this task assumes you have already created a project for your reports. If you are using BIRT RCP Report Designer, there is no requirement for a project.
1 Choose File➛New➛Report.
2 In New Report, select a project in which to store your report.
3 Type the following text as the file name:
Cust_Orders_Payments.rptdesign
4 Choose Finish. A blank report appears in the layout editor.
Task 2: Build a data source
Before you begin designing the report in the layout editor, you create a data source to connect the report to the Classic Models, Inc. database.
1 Choose Data Explorer.
2 Right-click Data Sources, and choose New Data Source from the context menu.
3 Select Classic Models Inc. Sample Database from the list of data sources, use the default data source name, then choose Next. Connection information about the new data source appears.
4 Choose Finish. BIRT Report Designer creates a new data source that connects to the sample database. The new data source appears within Data Sources in Data Explorer.
Task 3: Build a data set for the customer report
In this procedure, you build a data set to indicate what data to retrieve from the Customers table. The customer report that you create later uses this data set.
1 In Data Explorer, right-click Data Sets, and choose New Data Set.
2 In New Data Set, type the following text for data set name:
Customers
Use the default values for the other fields.
Data Source Selection shows the name of the data source that you created earlier.
Data Set Type specifies that the data set uses a SQL SELECT query to retrieve the data.
3 Choose Next.
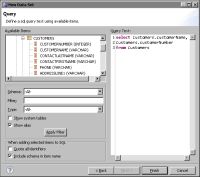
4 In Query, in Available Items, expand CLASSICMODELS, then expand the Customers table. The columns in the Customers table appear.
5 Use the following SQL SELECT statement to indicate what data to retrieve. You can type the column and table names, or you can drag them from Available Items to the appropriate location in the SELECT statement.
select CLASSICMODELS.CUSTOMERS.CUSTOMERNAME,
CLASSICMODELS.CUSTOMERS.CUSTOMERNUMBER
from CLASSICMODELS.CUSTOMERS
This statement that you created, which is shown in Figure 14‑9, gets values from the CUSTOMERNAME and CUSTOMERNUMBER columns in the Customers table.
Figure 14‑9 Query for Customers data set
6 Choose Finish to save the data set.
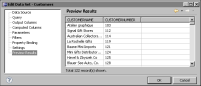
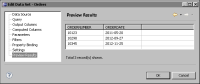
7 In Edit Data Set, choose Preview Results to confirm that the query returns the correct data. Figure 14‑10 shows some of the data rows that the data set returns.
Figure 14‑10 Data preview
8 Choose OK to save the data set.
Task 4: Build a data set for the orders subreport
In this procedure, you build a data set to indicate what data to extract from the Orders table. The orders subreport that you create later uses this data set.
1 In Data Explorer, right-click Data Sets, and choose New Data Set from the context menu.
2 In New Data Set, type the following text for the data set name:
Orders
3 Use the default values for the other fields, then choose Next.
4 In Query, in Available Items, expand CLASSICMODELS, then expand the Orders table to display the columns in the table.
5 Use the following SQL SELECT statement to indicate what data to retrieve:
select CLASSICMODELS.ORDERS.ORDERNUMBER,
CLASSICMODELS.ORDERS.ORDERDATE
from CLASSICMODELS.ORDERS
where CLASSICMODELS.ORDERS.CUSTOMERNUMBER = ?
This statement selects the ORDERNUMBER and ORDERDATE columns from the Orders table. The WHERE clause has a parameter marker for the value of CUSTOMERNUMBER. When the report runs, the orders subreport gets the current CUSTOMERNUMBER value from the customers report.
6 Choose Finish to save the data set.
7 In Edit Data Set, create a data set parameter to supply the CUSTOMERNUMBER value in the WHERE clause.
1 Choose Parameters from the left side of the window. Edit Data Set displays a default parameter definition.
2 Choose Edit to modify the parameter definition.
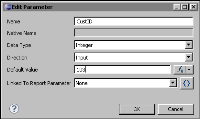
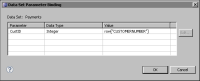
3 In Edit Parameter, specify the following values, as shown in Figure 14‑11:
Name: CustID
Data Type: Integer
Direction: Input
Default value: 103
103 is one of the values in the CUSTOMERNUMBER column. A default value is required for BIRT Report Designer to run the query for testing purposes.
Linked To Report Parameter: None
Figure 14‑11 Edited parameter definition
4 Choose OK to confirm your edits to the parameter definition. The parameter definition appears in Edit Data Set.
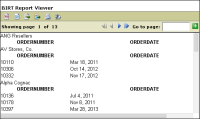
8 Choose Preview Results to confirm that the query returns the correct data. Figure 14‑12 shows the data rows that the data set returns for customer number 103.
Figure 14‑12 Data preview for the orders subreport
9 Choose OK to save the changes to the data set.
Task 5: Build a data set for the payments subreport
In this procedure, you build a data set to indicate what data to extract from the Payments table. The payments subreport that you create later uses this data set.
1 In Data Explorer, right-click Data Sets, and choose New Data Set from the context menu.
2 In New Data Set, type the following text for the data set name:
Payments
3 Use the default values for the other fields, then choose Next.
4 In Query, in Available Items, expand CLASSICMODELS, then expand the Payments table to display the columns in the table.
5 Use the following SQL SELECT statement to indicate what data to retrieve:
select CLASSICMODELS.PAYMENTS.PAYMENTDATE,
CLASSICMODELS.PAYMENTS.AMOUNT
from CLASSICMODELS.PAYMENTS
where CLASSICMODELS.PAYMENTS.CUSTOMERNUMBER = ?
This statement selects the PAYMENTDATE and AMOUNT columns from the Payments table. The WHERE clause has a parameter marker for the value of CUSTOMERNUMBER. When the report runs, the payments subreport gets the current CUSTOMERNUMBER value from the customers report.
6 Choose Finish to save the data set.
7 In Edit Data Set, create a data set parameter to supply the CUSTOMERNUMBER value for the WHERE clause.
1 Choose Parameters. Edit Data Set displays a default parameter.
2 Choose Edit to modify the parameter definition.
3 In Edit Parameter, specify the following values:
Name: CustID
Data Type: Integer
Direction: Input
Default value: 103
Linked To Report Parameter: None
4 Choose OK to confirm your edits to the parameter definition.
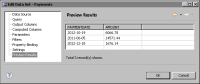
8 Choose Preview Results to confirm that the query returns the correct data. Figure 14‑13 shows the data rows that the data set returns for customer number 103.
Figure 14‑13 Data preview for the payments subreport
9 Choose OK to save the changes to the data set.
Task 6: Create the customer master report
You use a list element to create the master report and organize the orders and payments subreports within it. The list iterates through the customer data rows and creates the related orders and payments subreports for each record. For the sake of simplicity, the customer report displays just the customer name. It can, of course, display additional data, such as customer address, phone number, and credit limit.
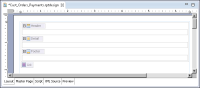
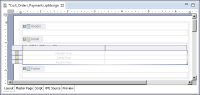
1 Drag a list element from the palette, and drop it in the report. The list element appears in the report, as shown in Figure 14‑14.
Figure 14‑14 List element
2 Associate, or bind, the list with the Customers data set.
1 In Property Editor, choose the Binding tab.
2 In Data Set, select Customers from the drop-down list.
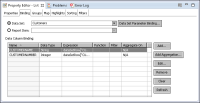
BIRT creates a column binding for each column in the Customers data set. Figure 14‑15 shows the binding information for the list.
Figure 14‑15 Binding information for the list element
3 Choose Data Explorer, expand Data Sets, then expand Customers. The columns that you specified in the query appear below Customers.
4 Drag CUSTOMERNAME from Data Explorer, and drop it in the detail area of the list. Figure 14‑16 shows what the report design looks like so far.
Figure 14‑16 Data set field in the list element
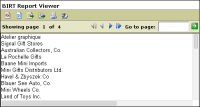
5 View the report with Run➛View Report➛In Web Viewer. The report should look like the one shown in Figure 14‑17. The report lists all the customer names in the order in which the data set returns them.
Figure 14‑17 Data preview for the master report
6 Sort the customer names in ascending order.
1 Choose Layout to resume editing the report.
2 In the layout editor, select the list element. Hover the mouse pointer over the bottom left corner to locate the List tab, then choose the tab.
3 In Property Editor, choose the Sorting tab.
4 In the Sort page, choose Add to create a sort expression.
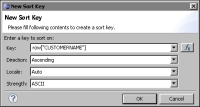
5 In New Sort Key, specify the following values, as shown in Figure 14‑18. Then, choose OK.
In Key, select CUSTOMERNAME from the drop-down list.
Use the default values for the other fields.
Figure 14‑18 Sort definition
7 View the report.
Task 7: Create the orders subreport
The orders subreport lists the orders for each customer in a row and column format. It displays the order number and date of each order. To iterate through the Orders data set rows and display them in a row and column format, you use the table element.
1 Choose Layout to resume editing the report.
2 Drag a table element from the palette, and drop it below the [CUSTOMERNAME] data element, in the detail area.
3 In Insert Table, specify the following values:
In Number of columns, type 2.
In Number of details, type 1.
In Data Set, select Orders from the drop-down list.
Choose OK. A table appears in the detail area of the list, as shown in Figure 14‑19.
Figure 14‑19 Table inserted in the detail area of the list
4 Choose Data Explorer, expand Data Sets, then expand Orders. The columns that you specified in the query appear below Orders.
5 Drag ORDERNUMBER from Data Explorer, and drop it in the first cell of the table’s detail row.
In the layout editor, the table cell containing the dropped data set field contains a data element that displays [ORDERNUMBER]. Above this data element is a label element that the layout editor adds to the header row. This label displays the field name as static text and serves as the column heading.
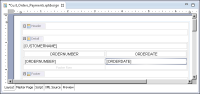
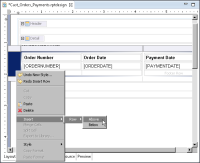
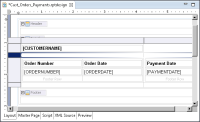
6 Drag ORDERDATE from Data Explorer, and drop it in the second cell in the detail row. The report design should look like the one shown in Figure 14‑20.
Figure 14‑20 Report design including the orders subreport
7 Sort the order rows by order number.
1 Select the Orders table.
2 In Property Editor, choose Sorting.
3 In the Sort page, choose Add to create a sort expression.
4 In New Sort Key, specify the following values, then choose OK:
In Key, select ORDERNUMBER from the drop-down list.
Use the default values for the other fields.
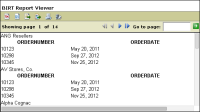
8 View the report. The report should look like the one shown in Figure 14‑21.
Figure 14‑21 Preview of the report showing repeated order records
The same order records appear for every customer because you specified a default value of 103 for customerNumber when you created the data set parameter, CustID. Using this default value, the orders subreport always displays the order records for customer 103. The solution is to update the value of the CustID parameter dynamically each time the customer row in the master report changes. This procedure is described in the next task.
The column headings appear in bold and are centered because BIRT Report Designer uses the browser’s default format for elements placed in a table header. You reformat these elements in a later task.
Task 8: Link the orders subreport to the customers master report
You link the orders subreport to the customers master report by binding the CustID parameter to the CUSTOMERNUMBER data set field in the customers report. Each time the customers report reaches a new customer row, the CustID parameter is updated with the new CUSTOMERNUMBER value.
1 Choose Layout to resume editing the report.
2 Select the Orders table.
3 In Property Editor, choose Binding.
4 In the Binding page, choose Data Set Parameter Binding.
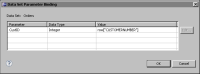
Data Set Parameter Binding displays the CustID parameter, as shown in Figure 14‑22. Its value is set to the default, 103, which you specified when you created the data set parameter.
Figure 14‑22 Data Set Parameter Binding for the Orders table
5 Change the parameter value to the CUSTOMERNUMBER field in the customers report.
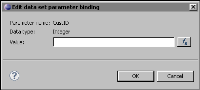
1 Select the parameter, then choose Edit. Edit data set parameter binding, shown in Figure 14‑23, prompts you to specify a new parameter value.
Figure 14‑23 Edit data set parameter binding
2 Choose the expression builder button that appears to the right of the Value field.
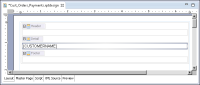
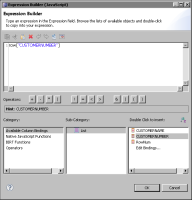
3 In the expression builder, choose Available Column Bindings, choose List, then double-click CUSTOMERNUMBER. The expression builder displays the expression, row["CUSTOMERNUMBER"], as shown in Figure 14‑24.
Figure 14‑24 CUSTOMERNUMBER field in the expression builder
Choose OK to save the expression and close the expression builder.
4 In Edit data set parameter binding, choose OK to accept the new parameter value. Data Set Parameter Binding displays the new value of row["CUSTOMERNUMBER"] for the CustID parameter, as shown in Figure 14‑25.
Figure 14‑25 Updated data set parameter binding
6 Choose OK to save the changed data set parameter binding.
7 View the report. It should look like the one shown in Figure 14‑26.
Figure 14‑26 Preview of the report shows correct orders data
Now different order records appear for different customers. Not all customers have order records. To display only customers that have orders, you change the query for the customers report. This task is described later in Task 11: “Display only customers that have orders or payments.”
Task 9: Create the payments subreport
The payments subreport shows, in a row and column format, the payments that each customer made. It displays the payment date and amount paid. To iterate through the Payments data set rows and display them in a row and column format, you use a table element. This time, you use an alternate and quicker method to insert the table and the data set fields in the table.
1 Choose Layout to resume editing the report.
2 Choose Data Explorer, and expand Data Sets.
3 Drag the Payments data set, and drop it below the orders subreport, in the detail area of the list.
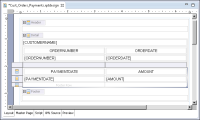
BIRT Report Designer inserts a table in the report, and places all the data set fields in the detail row of the table. BIRT Report Designer also inserts labels in the header row of the table. The report design should look like the one shown in Figure 14‑27.
Figure 14‑27 Report design including the payments subreport
4 Sort the payment rows by payment date.
1 Select the Payments table.
2 In Property Editor, choose Sorting.
3 In the Sort page, choose Add to create a sort expression.
4 In New Sort Key, specify the following values, then choose OK:
In Key, select PAYMENTDATE from the drop-down list.
Use the default values for the other fields.
5 View the report. The same payment records repeat for every customer because you specified a default value of 103 for customerNumber when you created the parameter, CustID, for the Payments data set. Just as you did for the orders subreport, you need to dynamically update the value of the CustID parameter for each customer in the master report.
Task 10: Link the payments subreport to the customers master report
You link the payments subreport to the customers master report by binding its CustID parameter to the CUSTOMERNUMBER field in the customers report.
1 Choose Layout to resume editing the report.
2 Select the Payments table.
3 In Property Editor, choose the Binding tab.
4 In the Binding page, choose Data Set Parameter Binding. Data Set Parameter Binding displays the CustID parameter. Its value is set to the default, 103, which you specified when you created the data set parameter.
5 Change the parameter value to the CUSTOMERNUMBER field in the customers report.
1 Select the parameter, then choose Edit. A dialog prompts you specify a parameter value.
2 Choose the expression builder button that appears on the right of the Value field.
3 In the expression builder, choose Available Column Bindings, choose List, then double-click CUSTOMERNUMBER. The expression builder displays the expression row["CUSTOMERNUMBER"]. Choose OK to save the expression and close the expression builder.
4 In Edit data set parameter binding, choose OK to accept the new parameter value. Data Set Parameter Binding displays the new value of row["CUSTOMERNUMBER"] for the CustID parameter, as shown in Figure 14‑28.
Figure 14‑28 Modified data set parameter binding for the Payments table
6 Choose OK to save the changed data set parameter binding.
7 View the report. Now the report displays different payment records for different customers. Not all customers have payment records. To display only customers that have payments or orders, you change the query for the customers report.
Task 11: Display only customers that have orders or payments
The database contains customers that do not have orders or payments. The query for the customers report returns all customers. When you run the report, there are customer rows that show only the column headings for the Orders and Payments tables, as shown in Figure 14‑29.
Figure 14‑29 Report showing no order or payment data for one customer
You can exclude customers that do not have orders or payments by changing the query for the customers report.
1 Choose Layout to resume editing the report.
2 In Data Explorer, expand Data Sets, right-click Customers, then choose Edit.
3 Add the following SQL lines to the end of the existing query:
where exists
(select CLASSICMODELS.ORDERS.CUSTOMERNUMBER
from CLASSICMODELS.ORDERS
where CLASSICMODELS.CUSTOMERS.CUSTOMERNUMBER =
CLASSICMODELS.ORDERS.CUSTOMERNUMBER)
or exists
(select CLASSICMODELS.PAYMENTS.CUSTOMERNUMBER
from CLASSICMODELS.PAYMENTS
where CLASSICMODELS.CUSTOMERS.CUSTOMERNUMBER =
CLASSICMODELS.PAYMENTS.CUSTOMERNUMBER)
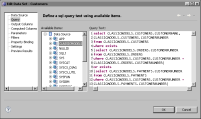
The WHERE EXISTS clause checks the Orders and Payments tables for customerNumber values that match the customerNumber values in the Customers table. Only rows that have matching customerNumber values are selected. The complete query should look like the one shown in Figure 14‑30.
Figure 14‑30 Updated SELECT query in Edit Data Set
4 Choose Preview Results to verify that the query returns rows, then choose OK to save the change to the data set.
5 View the report. Scroll down the report to check the output. The report no longer displays customers that do not have orders or payments.
Task 12: Display the subreports next to one another
Now that the subreports display the correct data, you can focus on laying out the subreports next to one another. Placing two tables next to one another does not work because BIRT Report Designer creates block-level elements, which means that each element starts on a new line. To display side-by-side tables, you insert the tables in a grid. The grid enables you to align elements easily.
1 Choose Layout to resume editing the report.
2 Drag a grid element from the palette, and drop it into the Detail row, between the [CUSTOMERNAME] data element and the Orders table. Before you drop the grid, make sure the straight cursor appears on the left side of the Orders table.
Insert Grid prompts you to specify the number of columns and rows for the grid.
3 In Number of columns, type 2 and in Number of rows, type 2, then choose OK. A grid with two columns and two rows appears in the layout editor.
4 Move the Orders table to the first cell in the first grid row. To do so, select the Table tab in the bottom left corner of the table, then drag the table and drop it in the grid cell.
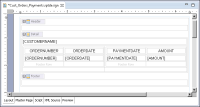
5 Move the Payments table to the second grid cell. The report layout should look like the one shown in Figure 14‑31.
Figure 14‑31 Side-by-side subreports in the report design
6 View the report. The report should look like the one shown in Figure 14‑32.
This report contains several levels of nested elements. At the top-most level is the list element. Within the list is a grid, which contains two tables. Within each table are data elements. The layout editor shows the borders of container elements and data elements, but for a container using several levels of nested elements, it can be difficult to see and select individual elements.
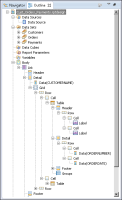
To get a clear view of the hierarchy of elements, use the Outline view. Figure 14‑33 shows the outline of the report, which appears when the layout editor is selected. Select Body, then expand each item to view all the elements in the report.
Figure 14‑33 Outline of the report
If you have difficulty selecting an element in the layout editor, select the element in the Outline view. When you select an element in Outline, the element is selected in the layout editor.
Task 14: Format the report
Now that the report displays the correct data and layout, you can turn your attention to improving the report’s appearance. You perform the following tasks to format the report so that it looks like the report shown in Figure 14‑8:
Highlight the customer names.
Edit and format the column headings.
Change the date formats.
Change the number formats.
Increase the vertical space between elements.
Highlight the customer names
1 In the layout editor, select the [CUSTOMERNAME] data element.
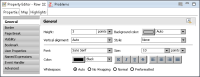
2 Choose the Properties tab of Property Editor.
3 Choose General from the list under Properties. Property Editor displays the general formatting properties of the data element.
4 Choose B to format the data as bold text.
Edit and format the column headings
When you insert a data set field in a table, BIRT Report Designer adds a label that has the data set field name in the header row. Often, data set field names are not in a form that is appropriate for reports, and need to be changed.
1 Double-click the first column heading in the Orders table. The text is highlighted.
2 Replace ORDERNUMBER with the following text, then press Enter:
Order Number
3 Repeat the previous steps to change the rest of the column headings to the following text:
Order Date
Payment Date
Amount
4 Create a style to format the column headings, using the following steps:
1 Choose Element➛Style➛New Style from the main menu.
2 In New Style, choose Predefined Style, then select table-header from the drop-down list.
3 Choose Font from the list of style properties on the left.
In Size, type 8, and use points as the measurement unit.
In Weight, select Bold.
4 Choose Text Block from the list of style properties. In Text Alignment, select Left.
5 Choose OK.
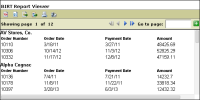
5 View the report. The report should look like the one shown in Figure 14‑34.
Figure 14‑34 Edited column headings in the report view
Change the date formats
When you insert a data element of date data type, BIRT Report Designer displays dates according to your system’s locale setting. You can select a different date format if you do not want to use the default format. In this procedure, you create a style that changes the format of ORDERDATE and PAYMENTDATE values from Jun 3, 2013 to 6/3/13.
1 Choose Layout to resume editing the report.
2 Select the data element that displays [ORDERDATE].
3 Choose Element➛Style➛New Style from the main menu.
4 In New Style, for Custom Style, type the following name:
Date_data
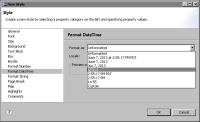
5 Choose Format DateTime from the list of style properties.
6 Choose the m/d/yy format from the drop-down list, as shown in Figure 14‑35. The values in the drop-down list dynamically update using the current date.
Figure 14‑35 DateTime formats
7 Choose OK. BIRT applies the Date_data style to the [ORDERDATE] data element.
8 Apply the Date_data style to the payment date data element. Right-click the [PAYMENTDATE] data element, then choose Style➛Apply Style➛Date_data.
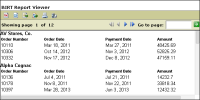
9 Preview the report. The dates have changed from Mar 18, 2011 format to 3/18/11 format, as shown in Figure 14‑36.
Figure 14‑36 Report view displaying the changed date formats
Change the number formats
When you insert a data element of a numeric data type, BIRT Report Designer displays numbers according to your system’s locale setting. You can select a different number format if you do not want to use the default format. In this procedure, you create a style that changes the amount values format from 48425.69 to $48,425.69.
1 Choose Layout to resume editing the report.
2 Select the data element that displays [AMOUNT] in the Payments table.
3 Choose Element➛Style➛New Style from the main menu. New Style displays properties in the general category.
4 For Custom Style, type the following name:
Currency_data
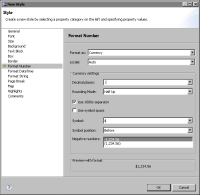
5 Choose Format Number from the list of style properties.
6 Specify the following formatting attributes:
For Format as, select Currency from the drop-down list.
7 Choose OK to save the style. The Currency_data style is applied to the [AMOUNT] data element, as indicated by the element’s Style property in Property Editor.
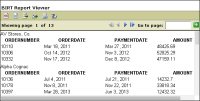
8 View the report. The numbers appear in the currency format, as shown in Figure 14‑38.
Figure 14‑38 Currency format in the report view
Increase the vertical space between elements
In this procedure, you increase the space between the customer name and the rows before and after it. To adjust the vertical space between elements, use any of the following techniques:
Increase the top or bottom padding or margins of elements.
Organize the elements in a grid and adjust the heights of the grid rows.
Organize the elements in a grid and use empty rows with specified heights to provide space between elements.
Padding and margins property values can yield different results in different web browsers. Using a grid to format the layout is easier and provides more predictable results. This procedure uses the third technique.
1 Choose Layout to resume editing the report.
2 Place the [CUSTOMERNAME] data element in the grid that contains the two tables by completing the following steps:
1 Select the grid. Hover the mouse pointer over the bottom left corner until the Grid tab appears, then choose the tab. Guide cells appear at the top and left of the selected grid.
2 Right-click the guide cell on the left of the grid’s first row, then choose Insert➛Row➛Above, as shown in Figure 14‑39.
Figure 14‑39 Inserting a new grid row
A new row appears above the selected row.
3 Move the [CUSTOMERNAME] data element from its current location to the first cell of the new grid row.
3 Using the procedures described earlier for adding a row, add a new grid row below the row that contains the [CUSTOMERNAME] data element.
4 Select the grid, then select the second row in the grid, as shown in Figure 14‑40.
Figure 14‑40 Selecting the second row
5 In General properties, set the row’s height to 3 points, as shown in Figure 14‑41.
Figure 14‑41 Setting the row height property
6 Select the fourth row in the grid, and set its height to 12 points.
7 View the report. There is more space above and below the customer name. The report should look like the one shown in Figure 14‑42.