A report that uses the iHub API returns the expected results only when it is run on iHub. When the report is run in Actuate BIRT Designer Professional, the report cannot access the iHub to retrieve the server information, and the report typically returns null values. Therefore, you cannot debug the iHub API calls in the same way you debug other event handlers in Actuate BIRT Designer Professional.
To debug iHub API calls, use the appendToJobStatus( ) method to write a debugging message for each event handler. For example, in a JavaScript event handler for the beforeFactory event, add the following line of debugging code:
The appendToJobStatus( ) method writes a specified string message in the status section of a job-completion notice. After running the report on iHub, you can view these messages in iHub client.
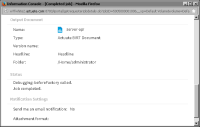
In iHub client, choose My Jobs➛Completed, then choose the job’s details. The job’s Status page displays the debug messages in the Status section, as shown in Figure 7‑3.
Figure 7‑3 Debug message in the job status page in iHub client