Tutorial 12: Adding scripted chart controls to a BIRT design
In this tutorial, you add HTML buttons to a BIRT design that implement controls for a chart in the BIRT design. You perform the following tasks:
*Add HTML buttons.
*Script the chart sub_type controls.
*Script the chart size controls.
*Test the scripts.
Task 1: Add HTML buttons
In this task, you review a BIRT report design called ChartWithHTMLButtons.rptdesign and create a grid of HTML buttons.
1 Open BIRT Designer Professional. In Navigator, navigate to and open ChartWithHTMLButtons.rptdesign.
2 Preview the report, as shown in Figure 17‑5.
Figure 17‑5 Previewing the report
3 Choose Layout to return to the layout editor.
4 Right-click the first cell of the table. Choose InsertGrid. On Insert Grid, set Number of columns to 2 and Number of rows to 2, then choose OK. A new grid appears above the chart, as shown in Figure 17‑6.
Figure 17‑6 Inserting a grid
5 To create HTML buttons for the report, perform the following steps:
1 Right-click the first cell of the grid. Choose InsertHTML Button.
2 On HTML Button, type "2D with Depth" into the value field.
3 Choose OK. If a warning message appears, choose OK.
6 Repeating the process of step 6, create an HTML button in the remaining empty cells of the grid with the values "2D", "resize 400x600", and "resize 600x400".
Task 2: Script the chart sub_type controls
In this task, you add event handler scripts to HTML buttons that change the subtype controls of the chart.
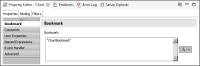
1 Select the chart. In the property editor, open PropertiesBookmark. Set the bookmark value to "ChartBookmark", as shown in Figure 17‑7.
Figure 17‑7 Setting the chart bookmark property
2 Select the 2D with Depth HTML button and choose Script.
3 In the New Event Function drop-down list, select onclick. The onclick event handler appears in the script editor text box.
4 After the first curly brace ( { ), add the following code:
var bchart = this.getViewer().getCurrentPageContent()
.getChartByBookmark("ChartBookmark");
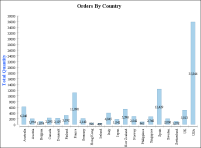
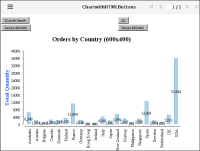
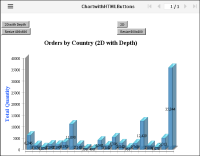
bchart.setChartTitle("Orders by Country (2D with Depth)");
bchart.setDimension(actuate.report.Chart
.CHART_DIMENSION_2D_WITH_DEPTH );
bchart.submit();
5 Return to the layout editor. Select the 2D HTML button and choose Script.
6 In the New Event Function drop-down list, select onclick. The onclick event handler appears in the script editor text box.
7 After the first curly brace ( { ), add the following code:
var bchart = this.getViewer().getCurrentPageContent()
.getChartByBookmark("ChartBookmark");
bchart.setChartTitle("Orders by Country");
bchart.setDimension(actuate.report.Chart.CHART_DIMENSION_2D );
bchart.submit();
Task 3: Script the chart size controls
In this task, you add event handler scripts to HTML buttons that change the display dimensions of the chart.
1 Select the Resize 400x600 HTML button and choose Script.
2 In the New Event Function drop-down list, select onclick. The onclick event handler appears in the script editor text box.
3 After the first curly brace ( { ), add the following code:
var bchart = this.getViewer().getCurrentPageContent()
.getChartByBookmark("ChartBookmark");
bchart.setChartTitle("Orders by Country (400x600)");
bchart.setSize(400,600);
bchart.submit();
4 Return to the layout editor. Select the Resize 600x400 HTML button and choose Script.
5 In the New Event Function drop-down list, select onclick. The onclick event handler appears in the script editor text box.
6 After the first curly brace ( { ), add the following code:
var bchart = this.getViewer().getCurrentPageContent()
.getChartByBookmark("ChartBookmark");
bchart.setChartTitle("Orders by Country (600x400)");
bchart.setSize(600,400);
bchart.submit();
Task 4: Test the scripts
In this task, you run the report and test the HTML button scripts.
1 Save the report.
2 View the report by choosing RunView ReportIn Web Viewer.
3 In the Actuate viewer, choose Resize 600x400. The report title changes and the report changes size, as shown in Figure 17‑8.
Figure 17‑8 A chart displaying 600x400 size
4 In the Actuate viewer, choose 2D with Depth. The report title changes and the report subtype changes to 2D with depth, as shown in Figure 17‑9.
Figure 17‑9 A chart with a 2D with Depth subtype
5 Choose other buttons to test scripted changes to the report display.