Tutorial 15: Adding scripted HTML5 Chart controls to a BIRT design
In this tutorial, you add HTML buttons to a BIRT design that implement controls for an HTML5 chart in the BIRT design. You perform the following tasks:
4 Right-click the first cell of the table. Choose Insert➛Grid. On Insert Grid, set the Number of columns to 2 and Number of rows to 2, then choose OK. A new grid appears at the top of the table, as shown in Figure 17‑30.
Figure 17‑30 Inserting a grid
5 To create HTML buttons for the report, perform the following steps:
1 Right-click the first cell of the grid. Choose Insert➛HTML Button.
2 On HTML Button, type "Hide On Hold" into the value field.
3 Choose OK. If a warning message appears, choose OK.
6 Repeating the process of step 6, create an HTML button in the remaining empty cells of the grid with the values "Show On Hold", "Line Chart", and "Area Chart".
Task 2: Script the client chart controls
In this task, you add event handler scripts to HTML buttons that change the client chart series of the HTML5 chart.
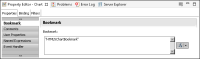
1 Select the chart. In the property editor, open Properties➛Bookmark. Set the bookmark value to "HTML5ChartBookmark" as shown in Figure 17‑31.
Figure 17‑31 Setting the chart bookmark property
2 Select the Hide On Hold HTML button and choose Script.
3 In the New Event Function drop-down list, select onclick. The onclick event handler appears in the script editor text box.
4 After the first curly brace ( { ), add the following code:
var bchart = this.getViewer().getCurrentPageContent()
.getChartByBookmark("HTML5ChartBookmark");
var clientChart = bchart.getClientChart();
clientChart.setTitle("HTML5 Chart: On Hold series is invisible");
clientChart.setSeriesVisibile('On Hold', false);
5 Return to the layout editor. Select the Show On Hold HTML button and choose Script.
6 In the New Event Function drop-down list, select onclick. The onclick event handler appears in the script editor text box.
7 After the first curly brace ( { ), add the following code:
var bchart = this.getViewer().getCurrentPageContent()
.getChartByBookmark("HTML5ChartBookmark");
var clientChart = bchart.getClientChart();
clientChart.setTitle("HTML5 Chart: On Hold series is visible");
clientChart.setSeriesVisibile('On Hold', true);
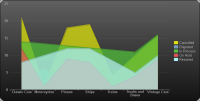
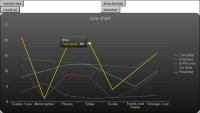
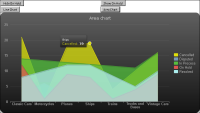
Task 3: Script the client option controls
In this task, you add event handler scripts to HTML buttons that change the chart type using the client options of the HTML5 chart.
1 Select the Line Chart HTML button and choose Script.
2 In the New Event Function drop-down list, select onclick. The onclick event handler appears in the script editor text box.
3 After the first curly brace ( { ), add the following code:
var bchart = this.getViewer().getCurrentPageContent()