A cross tab, or cross tabulation, displays data in a row-and-column matrix similar to a spreadsheet. A cross tab is ideal for concisely summarizing data. A cross tab displays aggregate values such as averages, counts, or sums in the cross tab’s cells.
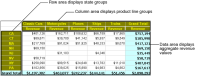
Figure 18‑1 shows a cross tab that organizes state groups in the row area and product line groups in the column area. Aggregate revenue values appear in the cells of the data area.
Figure 18‑1 Viewing a cross tab
A cell displays a revenue value by product line and by state, as shown in Figure 18‑2.
Figure 18‑2 A cell displaying a revenue total
A cross tab uses data from at least three fields. The cross tab in Figure 18‑1 uses the following data fields:
One field provides the values for column headings in the cross tab. The cross tab displays one column for each unique value in the field. In Figure 18‑1, the cross tab displays five unique values from the productline field: Classic Cars, Motorcycles, Planes, Ships, and Trains.
One field provides the values for row headings in the cross tab. The cross tab displays one row for each unique value in the field. In Figure 18‑1, the cross tab displays eight unique values from the state field: CA, CT, MA, NH, NJ, NV, NY, and PA.
Interactive Crosstabs aggregates one field’s values, and displays these values in the cross tab cells. In this example, each cell displays a revenue total by product line and state. Interactive Crosstabs calculates the revenue total using the SUM function on the values in the extendedprice field.