Tutorial 13: Using HTML buttons to apply filters to a chart
In this tutorial, you add multiple HTML buttons to an existing report that each add a filter for a different product line. An additional HTML button removes all filters to display data for all product lines.You perform the following tasks:
In this task, you preview a report called ButtonFilterChart.rptdesign and add the first HTML button that implements event handlers to apply a filter to the chart.
1 In Navigator, open ButtonFilterChart.rptdesign.
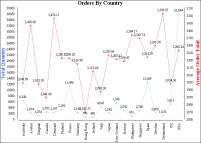
2 Choose Run➛View Report➛In Web Viewer to view the report, as shown in Figure 17‑10.
Figure 17‑10 Previewing the line chart report
3 Close the Web Viewer window. From Palette, drag an HTML button element into the first grid cell, as shown in Figure 17‑11.
Figure 17‑11 Viewing the location of the first HTML button
4 In HTML Button, type the following text for Value:
Classic Cars
5 Choose OK. If a warning appears displaying a message about adding functionality, choose OK.
6 Choose Script, as shown in Figure 17‑12, to access the script editor.
Figure 17‑12 Choosing Script
7 In New Event Function, select onclick.
8 In the function body for the onclick event handler, copy the code for the Classic Cars button shown in Listing 17‑1.
Listing 17‑1 Classic Cars JSAPI code
var bviewer = this.getViewer( );
var bpagecontents = bviewer.getCurrentPageContent( );
var bchart = bpagecontents.getChartByBookmark("ChartBookmark");
if (bchart == null) return;// unable to get handle to chart in case where chart becomes hidden
var filter = new actuate.data.Filter("PRODUCTLINE", actuate.data.Filter.EQ, "Classic Cars");
var filters = new Array( );
filters.push(filter);
bchart.setFilters(filters);
bchart.setChartTitle("Orders By Country (Classic Cars)");
bchart.submit( );
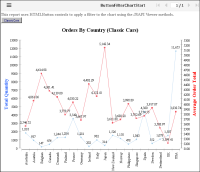
9 Preview the report in the web viewer by choosing Run➛View Report ➛In Web Viewer. Click on the Classic Cars HTML button that appears in the top left corner and the filtered chart appears as shown in Figure 17‑13.
10 Close Actuate Viewer.
Figure 17‑13 Previewing the report with the Classic Cars data
Task 2: Add HTML buttons for the remaining product lines
In this task, you add six HTML buttons, one for each of the remaining product lines.
1 Choose Layout to return to the layout editor. From Palette, drag an HTML button element into the next available grid cell. In HTML Button, for Value, type:
Motorcycles
Choose OK. If a warning appears displaying a message about adding functionality, choose OK. The HTML button appears in the layout editor.
2 Choose the Script tab. In New Event Function, select onclick.
3 Copy the code for the Classic Cars button shown in Listing 17‑1, and paste the code in the function body of the onclick event handler.
4 In Script, replace Classic Cars with Motorcycles in the following two lines:
var filter = new actuate.data.Filter("PRODUCTLINE", actuate.data.Filter.EQ, "Classic Cars");
and:
bchart.setChartTitle("Orders By Country (Classic Cars)");
The edited event handler appears as shown in Listing 17‑2.
Listing 17‑2 Motorcycles JSAPI code
var bviewer = this.getViewer( );
var bpagecontents = bviewer.getCurrentPageContent( );
var bchart = bpagecontents.getChartByBookmark("ChartBookmark");
if (bchart == null) return;// unable to get handle to chart in case where chart becomes hidden
var filter = new actuate.data.Filter("PRODUCTLINE", actuate.data.Filter.EQ, "Motorcycles");
var filters = new Array( );
filters.push(filter);
bchart.setFilters(filters);
bchart.setChartTitle("Orders By Country (Motorcycles)");
bchart.submit( );
5 Repeat steps 1 through 4 of this task for the following five buttons and data values:
Planes
Ships
Trains
Trucks and Buses
Vintage Cars
When complete, the report layout appears as shown in Figure 17‑14.
Figure 17‑14 Viewing filter buttons in Layout
Task 3: Add the final HTML button to the report
In this task, you add the final filter button to the report. This button is different from the previous buttons, in that it will clear any filter and display summary data for all product lines.
1 From Palette, drag an HTML button element into the remaining grid cell. In HTML Button, in Value, type:
Show All
Choose OK.
2 Choose Script. In New Event Function, select onclick.
3 In the function body for the onclick event handler, copy the code for the Show All button shown in Listing 17‑3.
Listing 17‑3 JSAPI code to remove filters from charts
var bviewer = this.getViewer( );
var bpagecontents = bviewer.getCurrentPageContent( );
var bchart = bpagecontents.getChartByBookmark("ChartBookmark");
if (bchart == null) return; // unable to get handle to chart in case where chart becomes hidden
bchart.clearFilters("PRODUCTLINE");
bchart.setChartTitle("Orders By Country");
bchart.submit( );
4 Choose Layout. The Show All button appears as shown in Figure 17‑15.
Figure 17‑15 Viewing all buttons in Layout
Task 4: Test the report
In this task, you test the report by selecting the various product line buttons.
1 Choose Run➛View Report➛In Web Viewer.
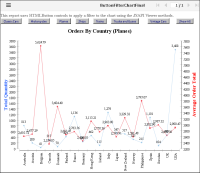
2 Choose the Planes HTML button. The chart changes, as shown in Figure 17‑16.
Figure 17‑16 Viewing the report after selecting the Planes HTML button