Using the Actuate JavaScript API in chart interactive features
BIRT reports support adding interactive features to a chart to enhance the behavior of a chart in the viewer. The interactive chart features are available through the chart builder. Implement Actuate JavaScript API functions within interactive features.
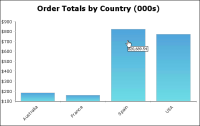
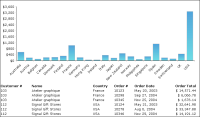
An interactive chart feature supports a response to an event, such as the report user choosing an item or moving the mouse pointer over an item. The response can trigger an action, such as opening a web page, drilling to a detail report, or changing the appearance of the chart. For example, use a tooltip to display the series total when a user places the mouse over a bar in a bar chart, as shown in Figure 17‑17.
Figure 17‑17 Chart showing a tooltip
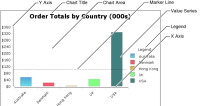
Interactive features can be added to a value series, the chart area, a legend, marker lines, the x‑ and y-axis, or a title. Figure 17‑18 identifies these elements.
Figure 17‑18 Elements selectable for chart interactivity
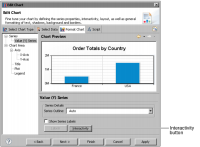
To add an interactive feature to a chart, either choose Format Chart in the chart builder and select a chart element to make interactive, or choose Script in the chart builder and select the chart element to make interactive. Figure 17‑19 shows the location of the Interactivity button for a value series.
Figure 17‑19 Accessing interactivity for a value series
Figure 17‑20 shows the elements accessible using the script feature.
Figure 17‑20 Accessing interactivity for a legend
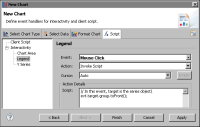
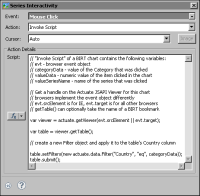
The location of the Interactivity button varies by chart element. Click the Interactivity button to display the interactivity editor. Figure 17‑21 shows the interactivity editor.
Figure 17‑21 Interactivity editor
The Action Details window displays a script that runs when the user clicks an item in the series. The script adds a filter to the table that displays below the chart. The filter restricts the data by the selected element. The code performs the following three tasks to handle this interactivity:
Obtains the bookmark for the table when the event occurs:
var viewer = actuate.getViewer(evt.srcElement || evt.originalTarget)
var table = viewer.getTable( );
The event is taken from the Invoke Script action of a BIRT chart. Set the Invoke Script action in the second field of the interactivity editor. The Invoke Script action contains the following variables:
evt: browser event object
categoryData: value of the selected category
valueData: numeric value of the selected item
valueSeriesName: name of the selected series
The code above uses getViewer and the evt object to obtain a handle for the viewer when an event occurs. The Firefox and Internet Explorer browsers implement the event differently. For Firefox, evt.originalTarget contains the name of the viewer object. For Internet Explorer, evt.srcElement contains the name of the viewer object.
The getTable( ) function retrieves the Table object for the first table in the viewer. To target a different table, use a specific table bookmark as the input parameter for getTableByBookmark( ).
This code example creates a new filter using the actuate.data.Filter constructor. The constructor takes three arguments:
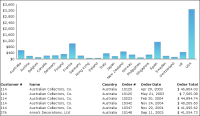
column name: The column name is the name of the series. In this case, the y-axis is a list of countries, so a mouse click filters the table according to the Country column.
operator: actuate.data.Filter.EQ is the constant definition for the equal to operator.
value: the value of the categoryData object generated by the event, which is a country. The filter returns rows with a Country value that matches the value selected by the user.
Submits the action for processing:
table.submit( );
The Actuate JavaScript API processes operations asynchronously. Actions are performed when submit( ) is called.