BIRT reports support adding themes to a chart to apply common elements to similar charts. Access chart themes by exporting and then editing a theme or by creating a new theme. Implement Actuate JavaScript API functions within specific theme elements or in the script feature of the theme.
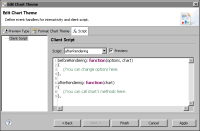
A chart theme supports executing a script before or after certain events, such as before rendering the chart. For example, you can add scripts for beforeGeneration, beforeRendering, beforeDrawAxis, beforeDrawSeries, beforeDrawDataPoint, and afterRendering when editing a chart theme, as shown in Figure 17‑28.
Figure 17‑28 Adding script elements in edit chart theme
In an HTML5 chart, you can use the actuate.report.HTML5Chart classes to alter the report display. For example, to render every data point in the series that is greater than avgValue in a green color, use code similar to the following: