The org.eclipse.birt.chart.examples plug-in is a collection of chart programming examples provided in the ChartSDK folder of the chart engine. To access the Java source code of the examples, extract the org.eclipse.birt.chart.examples.source plug-in’s JAR file to your workspace. Then, import those files as a project. Include the JAR files and the Java EE JAR file, servlet.jar, in the build path. Add further JAR files from the chart engine’s ChartSDK and Eclipse home plugins folders as necessary to resolve build errors in individual examples. To run the examples, use a Java application run configuration.
The examples are located in subdirectories of the plug-in’s src/org/eclipse /birt/chart/examples directory, called EXAMPLES_ROOT. Most of the examples consist of a Java application that displays a chart. The application classes, which have a main( ) method, are called viewer applications and their class names end in Viewer. Typically, these examples use one or more additional classes to build the chart. The following sections provide brief summaries of the examples in the chart examples plug-in.
api.data examples
The api.data package contains three examples, one that displays charts in a Java Swing environment and two that modify chart items in a report design.
DataCharts example
The DataCharts example consists of DataChartsViewer, a Java Swing application that uses the DataCharts class to build a chart. DataCharts displays hard-coded data values in the charts. Depending on user selection, the application builds one of the following kinds of charts:
A bar chart that has multiple y-axes
A bar chart that has multiple y-series
A pie chart that has a minimum slice
GroupOnXSeries example
The GroupOnXSeries example is a Java application that reads a BIRT report design and modifies and saves it. The original report design, NonGroupOnXSeries.rptdesign, contains a chart report item that uses data from a scripted data source. The chart item has no grouping on the x-series. The GroupOnXSeries Java application modifies the design so that the chart report item does group on the x-series. The application saves the modified report design as GroupOnXSeries.rptdesign. Open these report designs and preview the reports to see the effect of this modification.
GroupOnYAxis example
The GroupOnYAxis example is a Java application that reads a BIRT report design and modifies and saves it. The original report design, NonGroupOnYAxis.rptdesign, contains a chart report item that uses data from a scripted data source. The chart item has no grouping on the y-axis. The GroupOnYAxis Java application modifies the design so that the chart report item does group on the y-axis. The application saves the modified BIRT report design as GroupOnYAxis.rptdesign. Open these report designs and preview the reports to see the effect of this modification.
api.data.autobinding example
This example is an Eclipse SWT application that consists of the AutoDataBindingViewer class. This class instantiates an SWT Display object and adds a chart to it. The application creates data row structures, which it binds to the chart. Then, the application renders the chart.
api.format example
This example is a Java Swing application that consists of the FormatCharts and FormatChartsViewer Java classes. The FormatChartsViewer class displays an interface that presents choices to the user. Based on the user choice, FormatChartsViewer calls static methods in the FormatCharts class to build a chart. FormatChartsViewer then renders the chart. The methods in FormatCharts modify the following chart properties:
Axis format
Colored by category
Legend title
Percentage value
Plot format
Series format
api.interactivity examples
This set of related example applications demonstrate chart interactivity features in the three Java frameworks: SVG, Swing, and SWT. The viewer applications are SvgInteractivityViewer, SwingInteractivityViewer, and SwtInteractivityViewer. The viewer classes display an interface that presents the same interactivity choices to the user. Based on the choice, the viewer class calls static methods in InteractivityCharts to build an interactive chart. Then, the viewer renders the chart. The interactivity types in these charts are:
Displaying tooltips
Executing call-back code
Highlighting a series
Linking to an external site by using a URL
Toggling the visibility of a series
api.pdf example
This example is a Java application that builds a simple chart and renders it as a PDF file. The classes in the PDFChartGenerator example are ChartModels and PDFChartGenerator. ChartModels has a single method that builds a simple chart using hard-coded data values. PDFChartGenerator uses the BIRT charting API to render the chart into PDF format. The application saves the PDF file as test.pdf.
api.preference example
This example shows how a Java servlet can process URL parameters to set style preferences for a chart. The servlet class, PreferenceServlet, uses the ChartModels class to generate a chart. The servlet uses the style parameters in the LabelStyleProcessor class to affect the style of a label in the chart. The example also includes a help page, Help.htm, that explains how to:
Develop chart pages using JSPs and servlets.
Run the Preference example.
Set up Eclipse to work with Tomcat.
api.processor example
This example builds a simple chart and applies styles to text in the chart. The example consists of StyleChartViewer, an SWT application, and StyleProcessor, which implements the IStyleProcessor interface to create a style object. StyleChartViewer creates a chart and applies the style to text in the chart. Finally, StyleChartViewer renders the chart.
api.script examples
This example consists of two SWT applications, JavaScriptViewer and JavaViewer. Both applications present the same set of choices to the user. The appearance of the chart that appears for a particular user choice is the same for both viewers. Each choice calls a static method in the ScriptCharts class to create a chart and displays the event handlers that the chart implements. JavaScriptViewer calls ScriptCharts methods to build charts that have JavaScript event handlers. JavaViewer calls ScriptCharts methods to build charts that have Java event handlers.
The ScriptCharts class illustrates techniques for creating charts having report element event handlers. Methods in this class create charts having report element event handlers written in JavaScript. Each JavaScript event handler is defined as a single string in ScriptCharts. A further set of methods creates charts having the same functionality using report element event handlers written in Java. The Java event handlers are Java classes that are located in EXAMPLES_ROOT/api /script/java. The ScriptCharts methods that define a Java event handler pass a string containing the path of the Java class.
api.viewer examples
The api.viewer package contains example applications that create a wide variety of charts. Each class creates and displays a set of charts based on user choices. Each viewer class, except SwingLiveChartViewer.java, calls static methods in the PrimitiveCharts class to create the chart to display. PrimitiveCharts uses hard‑coded data values for each chart.
Chart3DViewer example
Chart3DViewer.java is an SWT application that displays the following chart types:
3D area chart
3D bar chart
3D line chart
CurveFittingViewer example
CurveFittingViewer.java is an SWT application that displays the following chart types:
Curve fitting area chart
Curve fitting bar chart
Curve fitting line chart
Curve fitting stock chart
DialChartViewer example
DialChartViewer.java is an SWT application that displays the following chart types:
Multiple-dial, multiple-region chart
Multiple-dial, single-region chart
Single-dial, multiple-region chart
Single-dial, single-region chart
SwingChartViewerSelector example
SwingChartViewerSelector.java is a Swing application that supports showing the same data values in different ways. For each chart type, the user can choose to show the chart as two-dimensional or two-dimensional with depth. The user can also choose to display the chart with axes transposed, with the values shown as percentages, or on a logarithmic scale. Some choices are available only for charts with axes. SwingChartViewerSelector displays the following chart types:
Area chart
Bar and line stacked chart
Bar chart
Bar chart that has two series
Bubble chart
Difference chart
Line chart
Pie chart
Pie chart that has four series
Scatter chart
Stock chart
SwingLiveChartViewer example
SwingChartLiveChartViewer.java is a Swing application that displays a live, animated chart with scrolling data.
SWTChartViewerSelector example
SWTChartViewerSelector.java is an SWT application that displays the same user interface choices and chart types as SwingChartViewerSelector.java.
builder example
The builder example consists of two Java classes, ChartWizardLauncher and DefaultDataServiceProviderImpl. ChartWizardLauncher attempts to read a chart from testCharts.chart. If the file exists, ChartWizardLauncher modifies that file. If the file does not exist, the application creates a new file. ChartWizardLauncher uses the BIRT chart wizard to create the chart. DefaultDataServiceProviderImpl provides a basic implementation of a simulated data service.
radar.ui example
The radar.ui example consists of the classes that provide the user interface pages for the radar chart.
report.api examples
The three report.api examples are all Java applications that have no user interface. These examples use the BIRT design engine to build a new BIRT report design file in the chart example plug-in’s output folder. All the report examples add the following components to the report design file in the order shown:
Master page
Data source
Data set
A chart element in the body of the report
All the report examples use the BIRT charting API to add a chart to the body slot of the report design. After running these applications, open the new report design file and preview the report to see the chart.
MeterChartExample example
The MeterChartExample example adds a meter chart to the report design. The name of the report design is MeterChartExample.rptdesign.
SalesReport example
The SalesReport example creates styles and adds a pie chart to the report design. The name of the report design is SalesReport.rptdesign.
StockReport example
The StockReport example adds a stock chart to the report design. The name of the report design is StockAnalysis.rptdesign.
report.design examples
The report designs in this folder demonstrate ways to display chart elements in a report design. BarChartWithinTableGroup.rptdesign shows how to use a chart in a table element. BarChartWithJavascript.rptdesign shows how to use JavaScript to modify the rendered chart when a user views the report. DynamicSeriesPieChart.rptdesign shows how to customize a pie chart.
report.design.script examples
The report designs in this folder contain chart elements that use the same JavaScript event handlers that the api.script examples create dynamically. These report designs show how the scripts appear in BIRT Report Designer.
view example
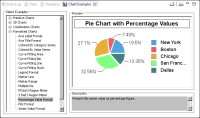
The view folder and its subfolders include the content for the Eclipse view, Chart Examples. To open this view, from the Eclipse main menu, choose Window➛Show View➛Other. On Show View, expand Report and Chart Design, then select Chart Examples and choose OK. By default, the Chart Examples view appears below the main window, in the same position as the console window. To use the Chart Examples view, expand a node on the left of the view, then select an item. The selected chart appears on the right of the view, as shown in Figure 6‑1.
Figure 6‑1 Chart Examples view showing the percentage value format example
To view the source code of the application that generates the selected chart, choose Open Java Source from the toolbar.
To save the XML of the chart item structure, choose Save XML Source from the toolbar.