One of the useful features in a report is the ability to display summary, or aggregate, data. Aggregating data involves performing a calculation on a set of values. For a simple listing report that does not organize data in groups, you can perform aggregate calculations on values in a selected column, across all the data rows in a table. For example, consider a report that has a column calculating extended price, price*quantity. You can use the sum of the calculations in this column to obtain the total extended price of all items. You can create up to three aggregations for each report column.
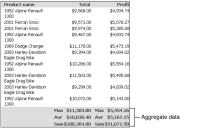
When you aggregate data, you choose whether the aggregation appears in the table header or footer. If the column is grouped, you can display the aggregate value in the group header or footer. The report in Figure 7‑12 displays aggregate data for the Total and the Profit columns at the end, or footer, of the table.
Figure 7‑12 Report displaying aggregate data
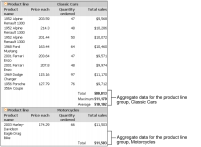
In a report that organizes data in groups, you can perform aggregations for each group of data rows, and for all the data rows in the table. In the example report shown in Figure 7‑13, the aggregate data appears at the footer of each group.
Figure 7‑13 Aggregate data by product line group
How to aggregate data
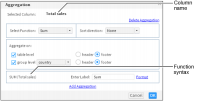
1 Select and right‑click the column containing the data to aggregate. Choose Aggregation. Aggregation appears. The syntax of the selected function appears in the lower part of Aggregation, as shown in Figure 7‑14. From the Select Function menu, select the aggregate function to use.
Figure 7‑14 Aggregating the Total sales column as a sum
2 Specify a sort direction for the resulting aggregation. If you select Ascending or Descending from the Sort direction list, the groups appear in ascending or descending order in the report. Select None if you do not want to sort the groups in any order.
3 In Aggregate on:
Select table level to aggregate data across all the rows in the table. Select either header or footer as the location in which to display the aggregate data.
Select a group from the next list to aggregate data at the group level. Select either header or footer as the location in which to display the aggregate data.
4 In Enter Label, enter a name for the label. Optionally, set a font for the aggregation label by choosing Format.
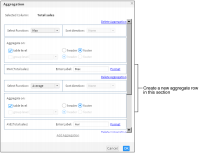
5 To create a second aggregation, choose Add Aggregation. In Select Function, select a function from the list. Repeat step 2 to step 4 to define the aggregation. Choose OK. Figure 7‑15 shows two aggregations defined for the report.
Figure 7‑15 Adding an aggregate row for a column
How to add additional aggregate rows to a column
After you create a single aggregate value for a column, you can add up to two more aggregate values for the same column. For an order total column, for example, you can create a sum of all the values, count all the values, and get the average order total.
1 To add an aggregate value, select a column that contains an aggregate value. Choose Aggregation from the context menu.
2 On Aggregation, choose Add Aggregation.
An additional section appears on Aggregation, shown in Figure 7‑15.
3 Create the second aggregate value and choose OK.
How to delete an aggregate value
1 Select the column that contains the aggregation to remove. From the context menu, choose Aggregation.
2 Aggregation appears, displaying all the aggregations for the column. Choose Delete Aggregation for the aggregation you want to remove. Choose OK.