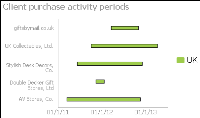
A Gantt chart graphically presents project scheduling information by displaying the duration of tasks. One axis contains the time series, and the other contains tasks. Gantt charts use symbols on bars to mark beginning and ending dates. Bars can use multiple colors to differentiate between stages. The colors of the bars represent the task status.
Figure 9‑12 shows a Gantt chart.