Gadgets are a chart‑like set of visualizations that generally display a single value, such as a meter or a gauge. Gadgets add animation and other visual elements that display data in a manner that is easy to understand. Gadgets differ from charts in that they generally only display a single value or a set of independent values and can represent less complex sets of data.
If your report contains gadgets, you can use Interactive Viewer to modify the subtype of the gadget, format the information that the gadget illustrates, create filters for gadget data, and export gadget data in a manner that is similar to performing these actions for chart data.
Using gadgets
You can work with meter, linear gauge, cylinder, thermometer, bullet, and sparkline gadgets using Interactive Viewer. The following section describes these gadgets and shows examples of each type of gadget.
Working with a meter gadget
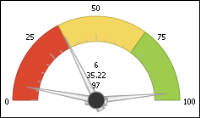
A meter is similar to the speedometer or fuel gauge of a car. It uses a radial scale to display the data range, and one or more needles to indicate data values. A meter displays specific data, utilizing an indicator that moves within a semi-circular range to indicate whether the monitored data is within defined limits. You can select colors for the data range to suit the application, such as green for satisfactory, yellow for caution, and red for alarm.
You can convert meter gadgets into linear gauge gadgets. The example in Figure 9‑30 shows shipped orders illustrated using a meter gadget.
Figure 9‑30 Meter gadget
Working with a linear gauge gadget
A linear gauge is a slider gauge with many additional features. It uses a horizontal scale to display your data range and fully configured data needles to indicate data values.
You can convert linear gauge gadgets into meter gadgets. The example in Figure 9‑31 uses a linear gauge to illustrate the revenue for resolved orders.
Figure 9‑31 Linear gauge gadget
Working with a cylinder gauge gadget
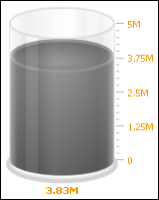
A cylinder gauge is represented by a vertical cylinder, whose fill level is indicative of the data to be displayed. It is used to show inventory levels, power plant reports, and fuel levels. The example in Figure 9‑32 uses a cylinder gadget to illustrate the potential revenue for orders that are on hold. You can convert cylinder gadgets into thermometer or bullet gadgets.
Figure 9‑32 Cylinder gadget
Working with a thermometer gadget
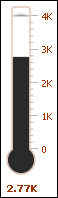
A thermometer gadget displays a single value. The fill level of the thermometer indicates the value. You can convert thermometer gadgets to cylinder gadgets or bullet gadgets. The example in Figure 9‑33 shows a thermometer gadget illustrating lost revenue for canceled orders.
Figure 9‑33 Thermometer gadget
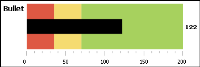
Working with a bullet gadget
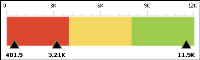
A bullet gadget is a variation of a bar chart and serves as a replacement for dashboard gauges and meters, which typically require too much space, and are cluttered with distracting decoration. There are horizontal and vertical bullet gadgets. The example in Figure 9‑34 shows a horizontal bullet gadget illustrating the expected revenue for orders in progress. You can convert bullet gadgets into cylinder gadgets or thermometer gadgets.
Figure 9‑34 Bullet gadget
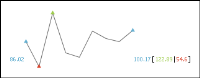
Working with a sparkline gadget
Sparkline gadgets are data‑intense, design‑simple, word‑sized graphics charts for embedding in a context of words, numbers, and images. Whereas the typical chart shows as much data as possible, and is set off from the flow of text, sparkline gadgets are succinct, memorable, and located where they are discussed. The example in Figure 9‑35 shows a sparkline gadget illustrating the volatility of product line orders. Sparkline gadgets have no subtypes.
Figure 9‑35 Sparkline gadget
The use of sparkline gadgets inline typically means that they are about the same height as the surrounding text. Also, sparkline charts can be used in space‑efficient executive dashboards to show a lot of KPIs in a single view.