In some charts that contain hierarchical data, such as a chart in a cross tab, Interactive Viewer supports drilling down into category or value series to view more detailed data, or drilling up to view summary data. For example, if the category axis of a chart displays location in regions, such as North America, EMEA, APAC, and so on, you can select a region to view detailed data for that region. You can then select each country in the region to view detailed data for that country, and select each city to view details about sales, customers, and so on, in the selected city. Similarly, you can drill up from a city view to get a summarized country view of the data, or a broader region view of the data.
In the following example, the category axis displays time in years. By selecting the label for each year, you can drill down to view detailed data for each quarter in the year and further to view details for each month in the quarter. Similarly, you can drill up to view summarized data for the same hierarchies. You can drill up from a month view, to a quarter view, or directly to a year view of the data in the chart. This section also explains how you can perform a similar action on hierarchical data in a value series.
How to drill down through a category series to view detailed information
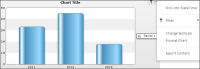
1 In Interactive Viewer, select and right‑click the chart. Choose Drill into 'DateTime', as shown in Figure 9‑20.
Figure 9‑20 Drilling into a year category
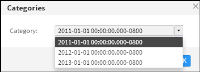
2 Categories appears listing the years for which data is available. Select a year from the list, as shown in Figure 9‑21. Choose OK.
Figure 9‑21 Selecting a year
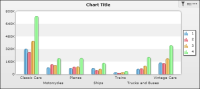
The chart displays data for the selected year, as shown in Figure 9‑22.
Figure 9‑22 Chart displaying data for four quarters in the year 2011
3 To drill further into subcategories of the data, from the chart menu, choose Drill into 'Quarter'.
4 Categories appears listing the quarters for which data can be viewed. Select the quarter for which you want to view detailed data, then choose OK.
The chart displays data for the quarter you selected.
How to drill up through a category series to view summary information
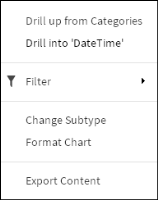
To drill up to a higher level in the data hierarchy, from the context menu, as shown in Figure 9‑23, choose Drill up from Categories or Drill into 'DateTime'.
Figure 9‑23 Drill-up menu
The chart in the report displays the data for the selected category.
In the following example, the category axis displays the product line, and the value axis displays sales. The data in the value series is grouped by year. You can drill down to view sales by product line for each quarter, or up to a higher level to view summary information across years.
How to drill down through a value series to view detailed information
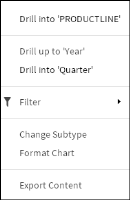
1 In Interactive Viewer, select and right‑click the chart. Choose Drill into 'Year,' as shown in Figure 9‑24.
Figure 9‑24 Drilling into time series
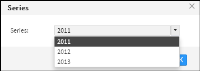
2 Series appears listing the years for which data is available. Select a year from the list, as shown in Figure 9‑25. Choose OK.
Figure 9‑25 Selecting a series value
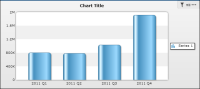
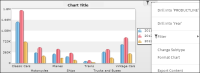
The chart displays data for the selected year, 2011, as shown in Figure 9‑26.
Figure 9‑26 Chart displaying sales for each quarter in 2011
3 To drill further into subcategories of the data, from the chart menu, choose Drill into 'Quarter'.
4 Series appears listing the quarters for which data can be viewed. Select the quarter for which you want to view detailed data, then choose OK.
The chart displays data for the quarter you selected.
How to drill up through a value series to view summary information
To drill up to a higher level in the data hierarchy, from the context menu, as shown in Figure 9‑27, choose Drill up to 'Year.' The chart in the report displays the data for the selected series.
Figure 9‑27 Selecting an option to view summary data
Interactive Viewer supports drill‑up and drill‑down capability for the following types of charts: