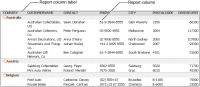
You can view BIRT (Business Intelligence Reporting Tools) reports using two web-based viewing environments, Actuate Viewer and Actuate Interactive Viewer. In this document, the term, viewers, refers to both Actuate Viewer and Interactive Viewer. A report is a category of documents that presents formatted and structured content from one or more data sources, such as a database, a spreadsheet, or a text file. A BIRT report can consist of several report components. At the very least, a BIRT report contains a table that holds data. In addition, a report can contain other elements such as animated or static charts, a cross tab, or a summary table. Figure 5‑1 shows a simple listing report displaying credit limit information for customers, sorted by country.
Figure 5‑1 An example report
This section describes the viewers and highlights the capabilities and functions of the viewers to navigate a report, print report data, and export the report and report data to several other formats. In addition, Interactive Viewer provides a high degree of interactivity, enabling users to easily modify the layout and formatting of reports, organize report data by sorting, filtering and grouping, perform calculations and compute report data, and edit graphical representations of report data by modifying charts in a report. You can also modify cross tabs and summary tables in a report and save the modified reports using Interactive Viewer.
If you need to analyze data in a cross tab, you can launch Interactive Crosstabs and modify data in the cross tab. Detailed information about performing each of these tasks is available in later sections of this document. In cases where the user interface does not display a specific option described in this document, upgrade to Interactive Viewer to access additional functionality.
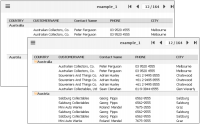
The Actuate Viewer interface consists of a toolbar with the main menu icon and a page navigation tool. The report occupies the remaining portion of the viewer, as shown in Figure 5‑2. The report on the left in Figure 5‑2 is displayed in Actuate Viewer, and the report on the right is displayed in Interactive Viewer.
Figure 5‑2 Viewing a report in the viewers
Users working with Actuate Dashboards to interact with gadgets, such as chart gadgets or table gadgets, can access most menu options described in this document from the context menu of each gadget.