A cross tab displays summary, or aggregate values, such as sums, counts, or averages, in a row‑and‑column matrix similar to a spreadsheet. For example, you can use a cross tab to view sales data for each product line, by year, or total sales for each product line, by geography, and so on.
The aggregate values in a cross tab are arranged in dimensions and measures, and each cross tab can display multiple dimensions and multiple measures.Dimensions are categories, such as products, customers, or sales periods, by which measures are aggregated. Measures represent values that are counted or aggregated, such as costs or units of products. Each detail cell in a cross tab displays an aggregate value.
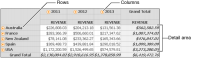
A cross tab consists of the following three areas, as shown in Figure 10‑1:
The row area
The column area
The detail area
The row and column areas contain the dimension values. The detail area contains one or more measures displaying aggregate data.
Figure 10‑1 shows the example report, which groups data by year. Each number in the cross tab represents the sales total of a country for a particular year. Grand Total displays the total sales across years for each country, and the total sales for each year across all countries. Grand Total also displays the total sales across all countries for all years.