A dashboard contains one or more gadget files that display data. Each gadget has actions common to all gadgets, such as printing, refreshing, and maximizing.
Some gadgets offer additional interactivity, depending on the gadget content. For example, report gadgets can include toolbars, launch browser-based tools, or contain hyperlinks to other Information Console documents or web sites.
You can interact with gadget content depending on the type of gadget:
Analyze and edit cross tabs or add a chart view using Interactive Crosstabs.
Export gadget content and data into a different format.
Filter displayed data using data selectors.
Modify and format reports and tables using Interactive Viewer.
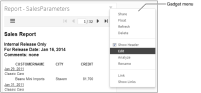
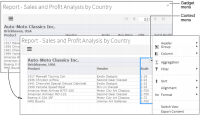
Gadgets on a dashboard include a menu to interact with the gadget and its contents, as shown in Figure 4‑23.
Figure 4‑23 Gadget menu
You can refresh data, interact with gadget content, or maximize gadgets to launch browser-based tools from shared dashboards. Users can move, resize, share, and edit gadgets on user dashboards.
Table 4‑2 Gadget settings for shared and user gadgets
Option
Description
Shared
Edit
Show Header
Displays the gadget header, which includes the gadget icons
✓
Analyze
Maximizes selected gadget and launches appropriate browser-based tool
✓
✓
Bring To Front
Moves a floating gadget in front of other gadgets
✓
Delete
Removes the selected dashboard gadget
✓
Dock
Changes a gadget floating freely to a gadget that is docked to a dashboard column
✓
Edit
Displays general options and any special options available to the selected gadget
✓
Float
Changes a docked gadget to a floating gadget that can be moved freely
✓
Link
Chooses one or more data selection gadgets on the current dashboard that can filter data in the current gadget
✓
Maximize
Maximizes selected gadget and launches appropriate browser-based tool
✓
✓
Refresh
Reloads the content of the selected gadget
✓
✓
Rename
Changes the name of the selected gadget
✓
Restore
Restores a maximized gadget to its original size
✓
✓
Send To Back
Moves a floating gadget behind other gadgets
✓
Share
Enables you to specify sharing options and privileges
✓
Show Links
Displays an outline around gadgets that are linked together on the dashboard
✓
✓
Filtering gadget content
Users can filter data displayed in gadgets to only display data matching one or more filter conditions. For example, to view top customers in a city, a user filters a pie chart of customers from the selected city whose total purchases are above $30,000 USD. The following gadgets support filtering data:
Chart gadgets
Measurement gadgets
Table gadgets
To filter report and Reportlet gadgets, use interactive mode to maximize the gadget.
Summary tables have special requirements when mixing Top and Bottom filter conditions with other filter conditions. In this case, the Equal to, Not Equal To, In, and Not In filter operators are not supported if the column values are a Float or Double data type. Use the Between operator in place of the Equal to operator to obtain correct results.
For example, you filter a summary table by the top five values in a column. You want to filter an additional column that uses Float data types to show revenue values. Use the filter operator Between 100068.76 and 100068.77 instead of using Equal to 100068.76000000001.
How to filter a chart gadget
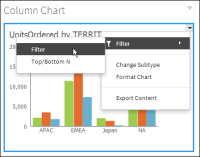
1 Select the gadget content to display the chart context menu. Choose the context menu. Figure 4‑24 shows the gadget context menu.
Figure 4‑24 Displaying a chart gadget’s context menu
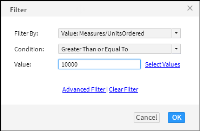
Select the data to filter. This example uses Value:Measures/UnitsOrdered.
Select the filter condition. This example uses Greater Than or Equal To.
Type a value. This example uses 10000.
Figure 4‑26 shows and example of selected filter values.
Figure 4‑26 Creating a filter
3 Choose OK to apply the filter condition.
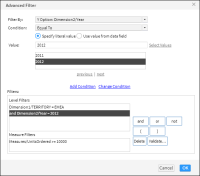
Optionally, choose Select Values to see a list of possible values. Choose Advanced Filter to create additional filter conditions. Clear Filter erases the current values. Figure 4‑27 shows an example of advanced filter conditions.
Figure 4‑27 Creating an advanced filter condition
Filtering top and bottom values
You can filter top and bottom values displayed in a gadget to the highest or lowest values in a data set. For example, you can display the top 15% of sales or the lowest 25 customer orders. The following gadgets support filtering top and bottom values:
Chart gadgets
Table gadgets
To use top and bottom filtering for report and Reportlet gadgets in interactive mode, maximize the gadget.
How to filter the top values in a chart gadget
1 Select the chart content. The context menu appears.
2 Choose the context menu.
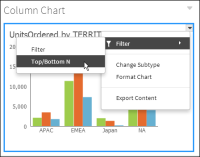
3 Choose Filter➛Top/Bottom N, as shown in Figure 4‑28.
Figure 4‑28 Filtering the top or bottom values of a gadget’s data
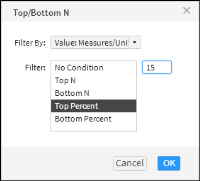
4 In Top/Bottom N, in Filter, select Top Percent and enter a value of 15, as shown in Figure 4‑29.
Figure 4‑29 Adding a top filter
5 Choose OK. The chart gadget displays the top 15% of the selected data.
Exporting gadget content
Report and data visualization gadgets can export visual content in the following formats: Microsoft Excel, Microsoft PowerPoint, Microsoft Word, PDF, PostScript, and XHTML formats
How to export a PDF from a report gadget
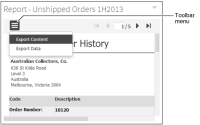
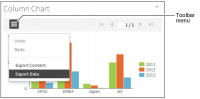
1 Select Export Content, as shown in Figure 4‑30. Export Content appears.
Figure 4‑30 Exporting report gadget content
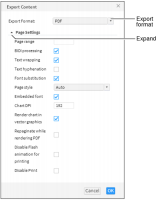
2 In Export Content, select the PDF export format and choose OK, as shown in Figure 4‑31. You can expand Page Settings for additional export options.
Figure 4‑31 Selecting the PDF export format
3 When prompted, save the PDF file to your desktop and open the file for printing using Adobe Reader.
How to export a PDF from a data visualization gadget
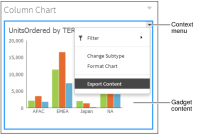
1 Select the gadget content to display the context menu.
2 Choose the context menu, as shown in Figure 4‑32.
Figure 4‑32 Opening a gadget’s context menu
Choose Export Content.
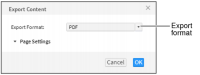
3 In Export Content, select the PDF export format and choose OK, as shown in Figure 4‑33.
Figure 4‑33 Selecting the PDF export format
4 When prompted, save the PDF file to your desktop and open the file for printing using Adobe Reader.
Exporting gadget data
Data displayed in a gadget is a result set from the gadget’s data source. Report and data visualization gadgets can export these result sets in the following formats: comma (CSV), pipe (PSV), tab (TSV), and semicolon (SSV). This data downloads as a file.
If you export column headers with the data, you can choose to export the column name or the display name. For example, if you export aggregated data from a table gadget and the column name is SUM(sold), exporting the column name gives the header name sold and exporting the display name gives the header name SUM(sold). Seeing the display name is useful when there are multiple aggregations of the same column data, such as SUM(sold), AVERAGE(sold) and MAX(sold).
Exported data can open in the user’s default viewing software for the selected data format. For example, after viewing a report of orders by a specific customer, the user wants to export a list of the order numbers to include in an e‑mail.
Exporting data from data visualization gadgets displays all result sets from all of your gadgets. Choose the name of the gadget from Available ResultSets to download the selected data. Chart gadgets export only their result set data while they are in minimized form.
Exporting data from report or Reportlet gadgets displays all result sets within the displayed BIRT document. Choose the result set from Available ResultSets to download the selected data.
Table 4‑3 lists gadgets that support exporting their data in different formats.
Table 4‑3 Availability of export data for dashboard gadgets
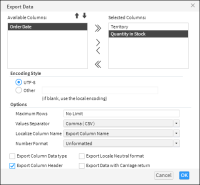
Select the desired columns from Available Columns. This example uses Territory and Quantity in Stock.
Select an encoding style. This example uses UTF-8.
Select additional data export options that match the requirements of the software that will process the exported data. This example sets Values Separator to Comma (CSV), as shown in Figure 4‑36.
Figure 4‑36 Choosing data to export from a gadget
4 Choose OK. Data download begins.
Exported files use the default viewing software installed on the user’s computer. If multiple viewers are available or there is no viewer for the selected file, the user can choose which software opens the file or choose to download the exported data file.
Maximizing gadgets
Although gadgets display in a column or freeform layout, users can maximize a gadget to fill the browser window. Maximizing a gadget enables more space for viewing data and can launch browser-based tools for editing.
The following browser-based tools are launched by maximizing gadgets on the dashboard:
Interactive Crosstabs launches from cross tab gadgets.
Interactive Viewer launches from chart, report, Reportlet, and table gadgets.
A browser-based tool can save changes to a gadget when the user has write privileges to the dashboard file.
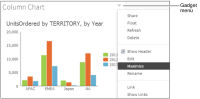
Gadgets are maximized by:
Double-clicking the gadget title
Selecting Analyze from the gadget menu
Selecting Maximize from the gadget menu
Interactive Viewer features, such as saving a file, hiding document parts, printing, and linking or embedding the document page, requires that the BIRT document or design file be opened from Information Console and not from within a gadget.
How to launch Interactive Crosstabs
Launch Interactive Crosstabs from a cross tab gadget or a report gadget that contains a cross tab by selecting Analyze from the gadget title. Optionally, double-click the cross tab gadget title to maximize the gadget.
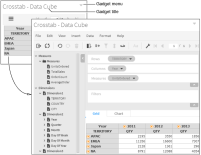
When the maximized gadget is a cross tab gadget, Interactive Crosstabs opens, as shown in Figure 4‑37.
Figure 4‑37 Launching Interactive Crosstabs from a cross tab gadget
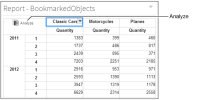
When the maximized gadget is a report, Reportlet or report library gadget, select the cross tab and choose Analyze, as shown in Figure 4‑38.
Figure 4‑38 Launching Interactive Crosstabs from a maximized report gadget
Interactive Crosstabs opens.
How to launch Interactive Viewer
Maximize a chart, report, Reportlet, or table gadget by selecting Maximize. Optionally, double-click the gadget title to launch Interactive Viewer.
After Interactive Viewer is enabled, right‑click part of the report to display the Interactive Viewer context menu, for example, right-click a title in a column to display sorting, filtering, and additional interaction choices.
Figure 4‑39 shows the process of maximizing a report gadget to enable interactive viewing such as custom formatting and aggregation.
Figure 4‑39 Launching Interactive Viewer from a gadget
Refreshing gadget content
Users can refresh a gadget to redraw the gadget content. To update gadgets displaying data from a BIRT data object, such as a data visualization gadget, refresh the web browser. Gadgets displaying BIRT documents, external web sites, or real-time data display the latest data when the user refreshes the gadget.
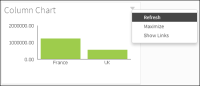
Choose Refresh from the gadget menu, as shown in Figure 4‑40, to refresh the content of a gadget.
Figure 4‑40 Refreshing content of a chart gadget
Showing linked gadgets
You can see which gadgets are linked to a selected gadget by choosing Show Linked Gadgets from a gadget menu. For example, a user wants to see if any data selection gadgets can change the table gadget they are reviewing. By selecting Show Linked Gadgets in the table gadget’s menu, the user can see which gadgets can change the data displayed in the table.
How to show linked gadgets
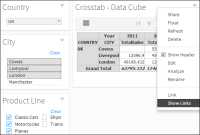
1 In the gadget menu, choose Show Links, as Figure 4‑41 shows.
Figure 4‑41 Showing gadgets linked to the cross tab
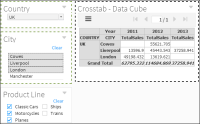
Gadgets that link to the selected gadget appear outlined, as Figure 4‑42 shows.
Figure 4‑42 Reviewing which gadgets are linked together
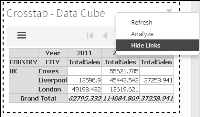
2 In the gadget menu, choose Hide Links, as shown in Figure 4‑43. The outline around linked gadgets disappears.
Figure 4‑43 Hiding linked gadgets
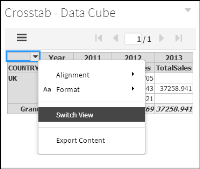
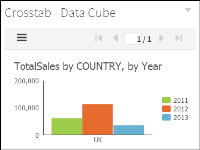
Switching the view of a cross tab gadget
Gadget developers can add a chart view to a cross tab to represent the data displayed in the gadget. When the chart view has been added, users can switch between the tabular view and chart view of the data displayed in the cross tab. Choose Switch View in the context menu of the cross tab gadget.
BIRT developers can also add chart views to tables and cross tabs in BIRT design files. This content appears in report and Reportlet gadgets on the dashboard, but this gadget must be maximized for Switch View to appear in the context menu.
How to switch views in a cross tab gadget
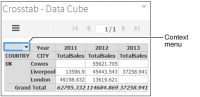
1 Select a cell in the cross tab content. A context menu appears, as Figure 4‑44 shows.
Figure 4‑44 Opening a cross tab gadget’s context menu