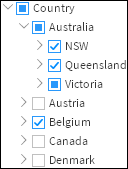
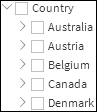
Each item in a tree selector can be in one of three states:
If the box contains a blue square, some but not all items in the category are selected. In Figure 4‑59, the box for Australia contains a blue square because NSW and Queensland are selected, but not all cities in Victoria are selected.
If the box is empty, no items in the category are selected. In Figure 4‑59, the box for Austria is empty because no provinces in Austria are selected.
If the box contains a check mark, all items in the category are selected. In Figure 4‑59, the box for Canada contains a check mark because all provinces in Canada are selected.
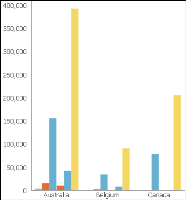
If you select Australia, Belgium, and Canada, as shown in Figure 4‑59, charts, tables, and crosstabs in the dashboard show only data for these countries, as shown in the bar chart in Figure 4‑60.
Figure 4‑60 Bar chart showing revenue for Australia, Belgium, and Canada
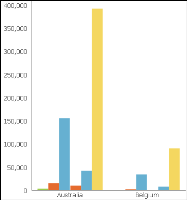
If you select Australia and Belgium, as shown in Figure 4‑61, charts, tables, and crosstabs in the dashboard show only data for these countries, as shown in the bar chart in Figure 4‑62.
Figure 4‑61 Selecting Australia and Belgium from a tree selector
Figure 4‑62 Bar chart showing revenue for Australia and Belgium
How to create a tree selector
1 On the Files and Folders page, choose Create➛New Dashboard.
2 In New Dashboard, on the tool bar, choose Data Selector.
3 Choose Tree View from the menu.
4 In Data Selector Gadget Wizard—Data, in Use Data, choose a data model from the drop-down list. If no data models appear, choose New Data.
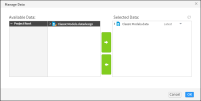
5 If you chose New Data in step 4, in Manage Data, in Available Data, select a data model and click the right arrow, as shown in Figure 4‑63. Choose OK.
Figure 4‑63 Selecting a data model
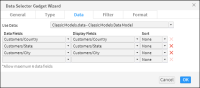
6 In Data Selector Gadget Wizard—Data, in Data Fields, choose the first field from the drop-down list.
7 Choose the second and subsequent fields up to a maximum of 6, as shown in Figure 4‑64. Choose OK. The tree selector appears in the dashboard, as shown in Figure 4‑65.