To define the output columns for an information object, use the Columns page. For example, you can create the following SQL fragment:
SELECT ename AS employee, (salary * 12) AS annual_comp
FROM Employees
How to define output columns
1 In the graphical information object editor, choose Columns.
2 In the upper pane, select the columns that you want to include and deselect the columns that you want to exclude from the query. To select all columns, select Select All at the top of the listing for that map or information object. By default, all columns in an information object are included in the query. The columns that you select appear in Columns.
3 In Columns:
To return only distinct rows, select Distinct values only. Some queries return duplicate rows. In a group of duplicate rows, each selected column contains the same value for all the rows in the group. If you want the query to return only one row for each group of duplicate rows, select Distinct values only. This setting affects only rows in which all column values match. The query still returns rows in which only some of the column values match. If the Analysis Type property is set to Dimension or Attribute for all columns in an information object, the DISTINCT keyword is automatically included in the query generated in Report Studio when the information object is used as a data source.
To change a column alias, type the new alias in Name. If a column alias contains a special character, such as a period (.) or a space, enclose the alias in double quotation marks ("). Do not use column aliases that are identical except for case. For example, do not use both status and STATUS as column aliases.
To enter an expression, select the source column, and type the expression or choose Ellipsis. Choosing Ellipsis opens Expression Builder.
To change the order of the columns, use the up and down arrows. If the information object uses column categories, you must reorder the columns in Column Categories.
4 To define column properties, such as the display name, select the column in Columns, and define the properties in Properties.
How to delete output columns
To delete an output column, select the column in Columns, and choose Remove. To delete all output columns, choose Remove All.
Creating and displaying column categories
If an information object has a large number of output columns, it is difficult for a user to locate a particular column. To help the user locate columns, you can organize them into categories. For example, for an information object that returns customer data, you can create a Customer address category that contains the columns StreetAddress, City, State, and PostalCode.
Creating column categories
Use the Column Categories page to create column categories. In Figure 3‑6, Column Categories lists a category with two columns.
How to create a column category or subcategory
1 In the graphical information object editor, choose Column Categories.
2 On Column Categories, right-click the Root node or a category name and choose Create.
3 On New Category, type the category or subcategory name and press Enter. You can provide a description for the category or subcategory in the Properties view.
4 Drag and drop columns into the category or subcategory. Figure 3‑6 shows the result of creating a Contact name category and moving the contact_first and contact_last columns into the category.
Figure 3‑6 Result of moving two columns into a new category
How to rename, move, or remove a category or subcategory
Table 3‑1 explains how to work with categories, subcategories, and columns on Column Categories.
Table 3‑1 Using Column Categories
Task
Method
Rename a category or subcategory.
Right-click the category or subcategory name and choose Rename.
Move a category or subcategory.
Drag and drop the category or subcategory in the target location.
Remove a category or subcategory.
Right-click the category or subcategory name and choose Remove➛Category only.
Remove a category or subcategory and its subcategories.
Right-click the category or subcategory name and choose Remove➛Category and subcategories.
Remove all categories and subcategories.
Right-click the Root node and choose Remove➛Category and subcategories.
Move a column.
Drag and drop the column in the target location. Reordering columns in Column Categories also reorders the columns in Columns.
Displaying column categories
The column categories that you create for an information object appear in the IO Design perspective, Information Object Query Builder, and Report Studio.
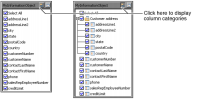
In the IO Design perspective, column categories appear in the Navigator view and the expression builder. Column categories do not appear in the upper pane of the graphical information object editor. To display column categories in the upper pane of the graphical information object editor, select Toggle categories view in the upper right corner of the information object, as shown in Figure 3‑7. The information object on the left does not display column categories. The information object on the right displays the Customer address category.
Figure 3‑7 Information object with and without categories displayed
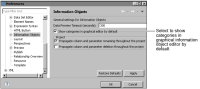
If you want column categories to display by default, choose Window➛Preferences➛Actuate BIRT➛Information Objects and select Show categories in graphical editor by default, as shown in Figure 3‑8.
Figure 3‑8 Showing categories by default
Column categories do not appear in the expression builder or the upper pane of the graphical information object editor for the information object in which they are defined. Column categories appear for information objects built from this source information object, in other words, for its dependent information objects.
In the Information Object Query Builder, column categories appear in Available Data, the upper pane of the query builder, and the expression builder.
In Report Studio, column categories appear in the Available Data pane.
Categories that do not contain columns appear in the Navigator view in the IO Design perspective, but not in the Information Object Query Builder or Report Studio.
Setting column properties
You set most column properties in the Properties view. You set default values for analytics properties in the Define Default Column Analytics wizard.
Setting column properties in the Properties view
Table 3‑2 lists column properties visible in the Properties view and a description of each property.
Table 3‑2 Column properties visible in the Properties view
Column property
Visibility
Description
Aggregate Type
Yes, in Define Default Column Analytics wizard
Default aggregate function for a column in a dashboard or Report Studio summary table, for example SUM.
Category Path
No
Path for column category and subcategories.
Conceal Value
Not used
Not used.
Data Type
No
Actuate SQL data type. If the data type is unknown, choose the Compile IO button.
Default Value
Not used
Do not specify a default value.
Description
✓
Description of the column that appears when the column is selected in Report Studio.
Description Key
✓
Key for Description property in localization properties file.
Display Control Type
Yes, in Prompt editor
Control type for a dynamic filter on this column in the report design. The available values are: text box, read-only drop-down list, editable drop-down list, or radio buttons.
Display Format
✓
Format to apply to column values in Report Studio output. To specify the display format, use an Actuate Basic format pattern or format keyword, such as Short date.
Display Length
✓
Number of characters to allow for display of column values in report output.
Display Name
✓
Display name for the column in Report Studio.
Display Name Key
✓
Key for Display Name property in localization properties file.
Do Not Prompt
Not used
Not used.
Expression
Yes, on the Columns tab
Expression for a computed field.
Filter
Yes
To create a predefined filter on the column in Actuate Query or a dynamic filter on the column in Information Object Query Builder, set to Predefined. To enable a user to create a custom filter on this column in Actuate Query or a dynamic filter on this column in Information Object Query Builder, set to Optional. To prevent filtering on this column, set to Disabled.
Has Null
✓
If column contains NULLs, set to True. Otherwise, set to False.
Heading
✓
The heading for the column in Report Studio output.
Heading Key
✓
Key for Heading property in localization properties file.
Help Text
✓
Balloon help for the column in Report Studio.
Help Text Key
✓
Key for Help Text property in localization properties file.
Horizontal Alignment
✓
Horizontal alignment of column values in Report Studio output. The available values are: left, right, or center.
Indexed
No
Indicates whether the column is indexed in the data source. True indicates that the column is indexed. False indicates that it is not indexed.
Name
Yes, on the Columns tab
The alias for the column in the information object query.
Required
Not used
Not used.
Text Format
✓
Not used.
Word Wrap
✓
To display text on multiple lines in Report Studio (with fixed width layout preference) output if the length of the text exceeds the width of the column, set to True. To truncate the text, set to False. This property is used only for columns that have the VARCHAR data type.
Setting default values for analytics properties
You can use an information object as a data source in a summary table in a dashboard or a Report Studio report. To create a summary table, users select a table’s auto-summarize feature, then select the data set column or columns whose data to group and aggregate. Because the grouping and aggregating are performed automatically, you must set default values for the analytics properties for each column. The analytics properties provide the appropriate context for these tasks. For example, it makes sense to group sales data by region or product line, but not by revenue. Conversely, it makes sense to aggregate revenue values, but not region or product line values.
To provide the appropriate information to generate a summary table, set each column’s analysis type property to one of the following values:
Dimension
The dimension analysis type supports the grouping of data in the column. For example, to display revenue by region, set the region column as a dimension.
Attribute
An attribute describes the items associated with a dimension. For a product dimension, for example, attributes might include color, size, and price. When you set a column as an attribute, you must also specify the dimension column of which it is an attribute. The summary table cannot group data in an attribute column.
Measure
The measure analysis type supports the aggregation of values in the column. For example, to calculate revenue totals, set the revenue column as a measure. The summary table cannot group data in a measure column.
If you do not set default values for the analysis type property, the following default values are used:
If the column contains numeric values or the data type is unknown, the default is measure.
If the column contains data of type TIMESTAMP, VARCHAR, or BOOLEAN, the default is dimension.
If the column is a primary key, a foreign key, or an indexed column in the database, the default is dimension regardless of the column’s data type.
Sometimes, the default values do not provide usable data for a summary table, so you should assign an analysis type for every column in an information object. One problem is that the default analysis type for columns that contain numeric values is measure. In some cases, however, users want to group on numeric values. For example, for a report that shows order numbers and order totals, users want to group on order number, but data in measure columns cannot be grouped.
If analysis type is set to Dimension or Attribute for all columns in an information object, the DISTINCT keyword is included in the query generated in Report Studio when the information object is used as a data source.
Use the Define Default Column Analytics wizard to specify default values for the following analytics properties for information object columns:
For each output column, specify the analysis type: dimension, measure, or attribute.
For each attribute column, specify the dimension of which it is an attribute.
For each measure column, specify the aggregate function.
How to specify default values for analytics properties
1 Open the information object or map in the graphical or textual editor.
2 Choose Columns or Output Columns.
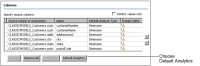
3 Choose Default Analytics, as shown in Figure 3‑9.
Figure 3‑9 Default Analytics button in Columns
4 In the first page of the Define Default Column Analytics wizard, specify the analysis type for each column, as shown in Figure 3‑10. Choose Next.
Figure 3‑10 Specifying the analysis type for information object columns
5 In the second page of the Define Default Column Analytics wizard, specify the dimension with which an attribute is associated, as shown in Figure 3‑11. Choose Next.
Figure 3‑11 Specifying the dimensions with which attributes are associated
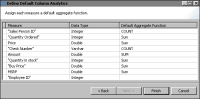
6 In the third page of the Define Default Column Analytics wizard, specify the aggregate function for measure columns, as shown in Figure 3‑12. You can choose a function from the drop-down list or type the name of a function. Choose Finish.
Figure 3‑12 Specifying the aggregate function for Check Number
About column property inheritance
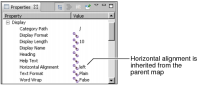
When you build an information object, its output columns inherit property values from the parent maps or information objects. For example, if you use an information object called IO1 to build another information object called IO2, IO2’s output columns inherit property values from the corresponding columns in IO1. If a column property value in IO1 changes, the change is propagated to IO2. For example, if the horizontal alignment for IO1.column01 changes from left to right and column01 is an output column in IO2, the horizontal alignment for IO2.column01 also changes from left to right. Changes to a map or information object’s Name property are not propagated, however. In Figure 3‑13, many of the column’s property values are inherited from the parent map.
Figure 3‑13 Inheritance of property values
If you change a property value for an output column, that property value is no longer inherited from the parent map or information object. For example, if you change the horizontal alignment for IO2.column01 to center and the horizontal alignment for IO1.column01 later changes to left, the change is not propagated to IO2.column01. In Figure 3‑14, the column’s horizontal alignment is not inherited from the parent map.
Figure 3‑14 Changing property value inheritance
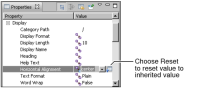
Choosing Reset for the appropriate property in Properties, as shown in Figure 3‑15, or in Prompt editor resets the property’s value to the inherited value. Any future changes to the property’s value in the parent map or information object are propagated.
Figure 3‑15 Resetting a property’s value
Values for the following column properties are inherited from the parent map or information object unless the values in the parent map or information object are blank:
Description
Display Name
Heading
Help Text
If the values in the parent map or information object are blank, the inheritance rules for these properties are as follows:
If you do not set the Display Name property, the Display Name property takes the value of the column’s Name property.
If you do not set the Heading property, the Heading property takes the value of the column’s Display Name property.
If you do not set the Description property, the Description property takes the value of the column’s Heading property.
If you do not set the Help Text property, the Help Text property takes the value of the column’s Description property.
In other words, if you do not set any of these properties and the values in the parent map or information object are blank, they all take the value of the column’s Name property. In this case, propagation of these properties occurs at run time.