The IO Design perspective in BIRT Designer Professional is built on the Eclipse integrated development environment. For information about perspectives and other Eclipse features, see the Workbench User Guide in the online help.
In iHub 3 and later releases, the IO Design perspective is not visible in BIRT Designer Professional until you enable it. The following section describes how to enable and launch the IO Design perspective.
How to launch the IO Design perspective
1 Launch BIRT Designer Professional.
2 Specify the workspace location, then choose OK.
Choose Create BIRT designs. The default Report Design perspective appears.
3 In the Report Design perspective, choose Window➛Open Perspective➛Other.
Open Perspective appears. Complete one of the following steps:
If the IO Design option appears in the list of perspectives, go to step 4.
If the IO Design option does not appear in the list of perspectives, choose Show All.
Open Perspective displays IO Design in the list of perspectives.
4 Choose IO Design, then choose OK.
BIRT Designer professional launches the IO Design perspective.
5 On the Welcome Screen that appears, choose Close.
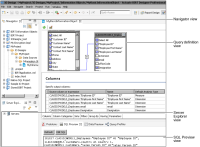
The IO Design perspective appears. Figure 1‑1 shows an example of an information object displayed in the IO Design perspective.
Figure 1‑1 The default IO Design perspective
The IO Design perspective displays the following views:
Navigator view
The Navigator view displays the contents of your projects. A project consists of data connection definitions, maps, information objects, and report designs.
Query definition view
You create the information object’s SQL query, either graphically or textually, in the query definition view.
Properties view
The Properties view displays the properties of the selected item, for example a column or table. To toggle the display of properties in categories, choose Show Categories.
Problems view
The Problems view displays error messages.
SQL Preview view
The SQL Preview view displays the information object’s SQL query.
Data Preview view
The Data Preview view displays map or information object output.
Query Profiler view
The Query Profiler view displays the query execution plan.
Server Explorer view
The Server Explorer view displays your iHub profiles.