Specific types of data are best depicted with a specific type of chart. This section describes the common types of charts you can modify in Interactive Viewer.
About bar charts
A bar chart, by default, displays data values as a set of vertical bars, but you can transpose the axes to display horizontal bars. A bar chart is useful for displaying data side‑by‑side for easy comparison. There are three subtypes of bar charts: side‑by‑side, stacked, and percent stacked. The stacked and percent stacked bar chart are functionally similar to the stacked area chart and percent stacked area chart subtypes.
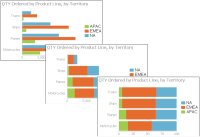
In a side‑by‑side bar chart, multiple series appear as side‑by‑side bars, as shown the chart on the left in Figure 8‑1. This bar chart uses the same data as the area charts, shown in the earlier sections.
In a stacked bar chart, multiple series are stacked vertically, as shown in the chart in the center in Figure 8‑1. The stacked bar chart shows totals for each category, each quarter in this example, as well as the proportion that each series contributes to the total.
Figure 8‑1 Side‑by‑side, stacked, and percent stacked bar charts
In a percent stacked bar chart, multiple series are stacked vertically, and the values are shown as a percentage of the whole. As shown in the chart on the right in Figure 8‑1, the sales values are shown in percentages instead of the actual numbers as shown in the previous bar charts.
Like the percent stacked area chart, the percent stacked bar chart is meaningful only when displaying and comparing multiple series. Do not use this chart subtype if you are displaying only one series, for example, only sales for Asia.