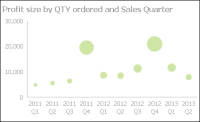
A bubble chart displays three sets of numeric data values at a time, two values are data points with x-y coordinates on the axes. The third value defines the size of the bubble at each point. A typical use of a bubble chart is to present financial data, such as quantity sold, profit margin and total profit sales of multiple product lines.
Figure 8‑13 shows a bubble chart.