The following section describes how you can modify data in a cross tab. In Interactive Viewer, you can change the appearance of data in a cross tab in the following ways:
Format data and labels by specifying font properties, and text alignment for a label, data element, or for the cross tab.
Change the width of a column or the height of a row.
Show details for cross tab data.
Format data strings depending on the type of data in the data element.
Apply page breaks after a specific number of rows or columns.
Additionally, in Interactive cross tabs, you can change the appearance of data in the cross tab in the following ways:
Choose from a list of themes to apply to a cross tab.
Hide or display empty columns or rows, or level and measure headers.
Specify a character string to display in empty cross tab cells.
Create conditional formatting rules based on which to display cross tab data.
Formatting a cross tab
To view available formatting options, right‑click a cross tab element. Choose Format to view the formatting options available for the selected element.
To format the values in a multilevel dimension group, select a cell in the grouped column, then from the context menu, select a formatting option. When you select a column to modify, the changes you specify are applied to the data values in each data group. If you choose the group at the highest level, the data values in this group are formatted based on the options you select. You must choose each group to specify formatting options for that group level. You can also specify formatting properties for the group label for each group.
Changing the width of a column or height of a row
Using Interactive Viewer and Interactive Crosstabs, you can optimize the layout of a cross tab by changing the width of cross tab columns and the height of rows. Using this option enables you to eliminate the extra space when you print or export the cross tab to other formats, and also creates additional space to avoid truncated column entries in the cross tab.
How to change column width
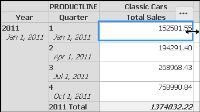
Select any cell in the cross tab. Hover the mouse pointer on the right or left border of the highlighted cell, as shown in Figure 9‑11. Using the mouse pointer, drag the border outward or inward to increase or decrease the width of the selected cell. The modified width applies to all rows in the column.
Figure 9‑11 Modifying column width in a cross tab
How to change row height
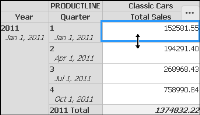
Select any cell in the cross tab. Hover the mouse pointer on the top or bottom border of the highlighted element, as shown in Figure 9‑12.
Figure 9‑12 Modifying row height in a cross tab
Using the mouse pointer, drag the border up or down to increase or decrease the height of the selected element. The modified height applies to the entire row.
Using themes
You can modify themes in a cross tab using Interactive Crosstabs. Themes are optional. Interactive Crosstabs provides a set of predefined themes, but you can also use custom themes, if they exist. A developer creates a theme library, a library (.rptlibrary) file, using BIRT Designer Professional, and publishes it to the Resources folder in the Encyclopedia volume, for example:
/Resources/ThemesReportItems3.rptlibrary
A library can include multiple themes if the library developer chooses to provide users with different style options to apply to cross tabs.
How to specify a theme for a cross tab
In Interactive Crosstabs, choose Format➛Theme. Select a theme from the menu that appears.
A cross tab displaying the Grayscale theme is shown in Figure 9‑13.
Figure 9‑13 Viewing the grayscale theme in a cross tab
Viewing details for cross tab data
Displaying detail tooltip information is specifically useful if you are analyzing data in a large cross tab where you cannot simultaneously view the column heading, row heading, and data cell in your browser window.
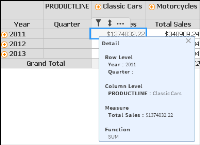
To view details, right-click any cell in the detail area, and choose Show Detail Tooltip. A tooltip displays the column and row-level details, the measure value, and which aggregate function applies for the selected cell, as shown in Figure 9‑14.
Figure 9‑14 Viewing details about cross tab data
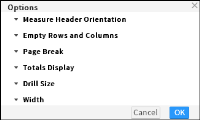
Specifying additional display options
Using Interactive Crosstabs, you can customize pagination properties in a cross tab by specifying the row and column interval for page breaks. You can additionally specify the display location for grand totals and subtotals, before or after the dimensions or measures, specify number of data rows to retrieve when drilling up or down dimension hierarchies, and specify cell width.
You can also specify display properties for header rows and empty cells in a cross tab. You can hide dimension level header and measure header rows using the cell context menu. You can also specify whether to display a measure header horizontally in a single row spanning the cross tab or vertically as rows in a single column. You can hide or display empty cells in a cross tab, and optionally specify a custom text string to display in the empty cells.