System Console provides detailed information on activity and resource usage in a cluster. System Console groups this information into the following categories:
Logs
Diagnostic logs the cluster creates
Trends
System-level information
Current Activity
Number of active requests the cluster is processing
How to access cluster activity and resource usage information
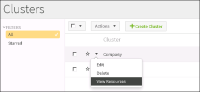
1 On Clusters, left‑click the arrowhead icon next to a cluster name and choose View Resources, as shown in Figure 7‑58.
Figure 7‑58 Choosing View Resources
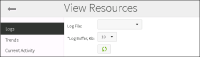
2 On View Resources, choose a category from the side menu, as shown in Figure 7‑59.
Figure 7‑59 Choosing a resource information category
The following sections describe the resource information categories.
Viewing diagnostic log files using Logs
The system administrator can view the diagnostic logs a cluster creates. Each log is an aggregate of the most recent log entries from every node in the cluster. An aggregate log exists for each of the following log types:
ihub
System log entries
ihubc
Volume log entries
ihubd
Process Management Daemon (PMD) log entries
jsrvrihub
View service log entries
lmserver
View monitoring service log entries
The system administrator chooses the type of log to view, and how much of the log to view.
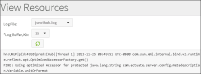
Each log entry contains the host name of the cluster node generating the log entry, the process ID, and the product name. Using the following jsrvribhub log entry as an example,
URUP is the host name, 4920 is the process id, and iHub is the product name.
How to view the diagnostic log
1 On Clusters, left-click the arrowhead icon next to a cluster name and choose View Resources.
2 From the side menu, choose Logs, as shown in Figure 7‑60.
Figure 7‑60 Choosing Logs
3 On View Resources—Logs, perform the following tasks:
1 In Log File, select the type of log file to view. For example, choose jsrvrihub.log.
2 In Log Buffer, Kb, select how many kilobytes of the log to view. For example, choose 10 KB.
The aggregated diagnostic log appears, as shown in Figure 7‑61.
Figure 7‑61 Viewing jsrvrihub.log
Viewing system-level information using Trends
System Console monitors each cluster and makes a broad range of system-level information on a cluster available for viewing, including statistics on cluster resource usage, performance, and load, presented in graphical and tabular formats.
How to view system-level information
1 On Clusters, left-click the arrowhead icon next to a cluster name and choose View Resources to access the list of system-level information categories.
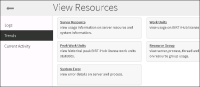
2 From the side menu, choose Trends, as shown in Figure 7‑62.
Figure 7‑62 Choosing Trends
3 Choose one of the following system-level information categories on View Resources—Trends. A new browser window opens, in which Actuate Viewer displays one or more charts or tables showing the information for the chosen category.
Server Resource
For each of the following statistics, System Console displays a chart showing the last 48 hours of activity for every node in the cluster. Each node appears as a line in the chart:
Response Time (milliseconds)
Left-click anywhere on a line in the chart to generate node‑specific charts showing the last 48 hours of activity for the following statistics:
Response Times (milliseconds)
Running Requests
Total Completed OnDemand Requests Today
CPU Usage (%)
Memory Usage (%)
Disk Usage (%)
When viewing the CPU Usage, Memory Usage, or Disk Usage charts, left‑click anywhere on a line in the chart to generate node-specific charts showing the last 48 hours of activity for each of the following statistics:
Memory, CPU and Disk Usage
Processes CPU Usage (%)
Processes Memory Usage (MB)
Work Units
Displays a chart showing usage for each of the following work units over the past 48 hours:
BIRT Online
BIRT Factory
Dashboards
Interactive Crosstabs
Report Studio
Peak Work Units
Displays a table showing the dates that each work unit reached a particular threshold, and the number of times the work unit reached the threshold on each date.
Resource Group
View process, thread and queue statistics on resource group. Displays a table showing the following information:
Time stamp
Date and time at which BIRT iHub used the resource group
Server name
Name of the server using the resource group
Resource group
Name of the resource group
Number of processes
Number of Factory processes the resource group can allocate for executing jobs
Busy threads
Number of threads running under a resource group
Queue size
Size of the queue where jobs wait to use the resource group
System Error
Displays a table listing system errors and their details.
About the Actuate Viewer menu
System Console displays each of the system-level information category views using Actuate Viewer. Actuate Viewer provides a menu that supports working with the contents of each system-level information category view.
Choose the icon in the banner of a system-level information view to access a menu containing the following options:
Disable Interactivity
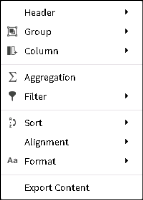
Disables interactivity on a chart or table in a system-level information category view. By default, Actuate Viewer displays a chart or table in a system-level category view with interactivity enabled. Interactivity enables control over any column or chart in the view. Left-click a column name or chart in the view. Choose the ellipsis to choose options such as filtering, sorting, alignment. Figure 7‑63 shows the menu for a column.
Figure 7‑63 Viewing the menu of column control options
Parameters
Supports refreshing the view. Choose Parameters. Then, choose Run Report.
Table of Contents
Supports immediately navigating to a location in the view.
Hide/Show Item
Supports hiding or showing one or more elements in a view, such as a chart, table, table column, or column label.
Link to this page
Provides a link to paste in an e-mail or message, or the HTML to embed in a web page.
Export Content
Supports downloading the view in one of the following formats:
Excel (XLS)
Excel (XLSX)
PDF
PostScript (PS)
PowerPoint (PPT)
PowerPoint (PPTX)
Word (DOC)
Word (DOCX)
XHTML
Export Data
Supports downloading the view data in one of the following file formats:
Comma (CSV)
Pipe (PSV)
Tab (TSV)
Semicolon (SSV)
Print
Supports printing the view.
Help
Accesses help for Actuate Viewer.
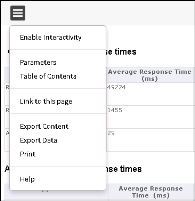
Figure 7‑64 shows an example of the menu, from the Request/Response Time by Category and Application view.
Figure 7‑64 Viewing the menu common to each system information view
Viewing Current Activity
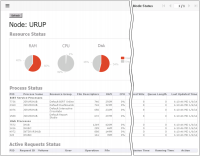
Current Activity shows the Node Active Request Summary, which lists the number of active requests each cluster node is processing. Choose a node name in the list to see a detailed status report for the node. The Node Status report displays statistics for the following categories, as shown in Figure 7‑65:
Figure 7‑65 Viewing the Node Status report
Resource Status
Displays the following resource usage statistics:
RAM
Percentage of total memory the node is using
CPU
Percentage of total CPU the node is using
Disk
Percentage of Disk space node is using
Process Status
Displays the following information about BIRT Service processes and BIRT iHub processes on the node:
PID
Process ID number
Process Name
Name of the process
Resource Group
The resource group running the process
File Descriptors
Number of file descriptors the process is using
RAM
Amount of memory in megabytes that the process is using
CPU
Percentage of CPU the process is using
Total threads
Total number of threads the process is using
Busy Worker Threads
Number of worker threads performing work
Acquired WUs
Number of acquired work units
Queue Length
Length of the queue
Last Updated Time
The time at which Process Status information was captured
Active Requests Status
Displays the following information about requests that are active on the node:
PID
Process ID number
Request ID
Request ID number
Volume
Volume on which the request is active
User
User who initiated the request
Operation
Type of operation the request is performing
File
File the request is using
Status
Status of the request
Submission time
Time the user submitted the request
Running time
Status of the request
Action
Action the system is taking for the request
How to view the list of active requests
1 On Clusters, left-click the arrowhead icon next to a cluster name and choose View Resources.
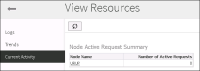
2 On View Resources, choose Current Activity to access the Node Active Request Summary. Then left-click the Refresh button to update the Node Active Request Summary, as shown in Figure 7‑66.
Figure 7‑66 Viewing the list of active requests
3 On Node Active Request Summary, choose the node name for which you want to view a node status report. For example, choosing the node name URUP in Figure 7‑66 generates the report shown in Figure 7‑65.