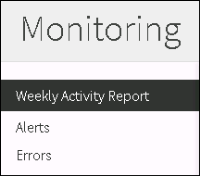
When the administrator logs in to System Console, System Console displays Monitoring. Monitoring consists of the following categories, which the administrator chooses from a side menu, as shown in Figure 6‑4:
Figure 6‑4 Monitoring menu options
Weekly Activity Report
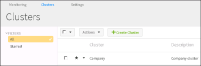
Displays the status of any starred cluster for each of the previous seven days. To star a cluster, choose Clusters. Then, on Clusters, select the star next to a cluster for which you want to view a Weekly Activity Report, as shown in Figure 6‑5.
Figure 6‑5 Starring a cluster
Alerts
Displays an alert if the attribute that System Console is monitoring has reached the alert threshold. Alerts displays the following information for an alert:
Cluster
Name of the cluster for which System Console generated the alert
Attribute Name
Name of the attribute System Console is monitoring
Timestamp
Date and time at which System Console generated the alert
Condition
Specifies the threshold that when reached, triggers an alert
Current Value
Current value of the attribute System Console is monitoring
Object Type
Type of object System Console is monitoring, for example, SERVER
Process
Name of BIRT iHub process, if applicable
Server
Machine name of the cluster node
Volume
Current value of the attribute System Console is monitoring
Email Address
E-mail address to which iHub sends notification of an alert
Errors
Displays error messages a cluster generates. Errors displays the following information for an error:
Cluster
Name of the cluster in which the error occurred
Host Name
Machine name of the cluster node in which the error occurred
Time Stamp
Date and time of the error
PID
Process identification number
Application
Name of the application
Thread ID
Identification number of the thread that was active when the error occurred