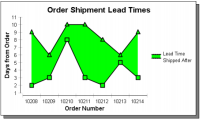
A difference chart typically shows variation between two sets of data by shading the areas between points of comparison. You can format the series of values to display positive areas in one color and negative areas in another. The light‑shaded spike in the chart shown in
Figure 20‑10 represents an unusual, short lead time between the request date and shipment of order 10210. The dark‑shaded area represents required lead time for each order, the difference in days between order receipt and shipment.