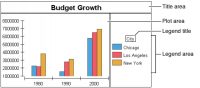
When you create a chart, the chart builder inserts the legend, plot, and title using default placement and size. You can rearrange or format the legend, plot, or title. Each area includes a client area outside the axes in which data or text appears. For example, Figure 22‑52 shows an outline around the legend. The text area in the legend uses a colored background.
Figure 22‑52 Areas in a chart
To highlight the plot, legend, or title, you can add a shadow behind that chart element. For example, Figure 22‑53 shows a shadow behind title text. A shadow uses basic or custom colors. You cannot use a gradient color as a shadow.
Figure 22‑53 Title using shadow
You can change the location of these chart elements, add inset padding to separate a part from another part, or change the way a part resizes when the chart expands or contracts. You adjust the layout using the following settings:
Anchoring
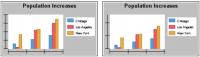
To change where the plot, legend, or title appears, change the anchoring. For example, Figure 22‑54 shows some of the different anchoring options for the legend text area within the legend area.
Figure 22‑54 Charts using different legend anchor settings
Anchor positions are relative to the plot area. For example, the title in the first example chart in Figure 22‑54 uses Top Right.
Insets
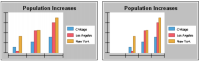
To adjust the padding around a chart area, modify the inset settings. For example, Figure 22‑55 shows the effect of increasing the top inset settings for the plot. The chart on the right uses higher inset settings for the plot and for the plot area within the axes, so more space appears between the top of the plot and the tops of the series markers.
Figure 22‑55 Charts using different plot inset settings
You also use inset settings to modify where the client area or text area appears within a chart area. For example, to change where series markers, such as bars in a bar chart, appear within the plot, change the plot client area insets. Figure 22‑56 shows the effect of increasing the left inset for a bar chart plot client area. The chart on the right uses a higher inset setting, so more space appears between the plot client area, where the bars appear, and the edge of the rest of the plot.
Figure 22‑56 Charts using different plot client area inset settings
Visibility
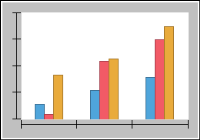
You can hide the title and legend of a chart, as shown in Figure 22‑57.
Figure 22‑57 Chart not using a title or legend
The following sections describe how to arrange and format the chart plot, legend, and title.