Axis markers highlight numbers or ranges on two-dimensional charts or charts with depth. You can use the following types of markers:
A marker line is a line that extends across the plot from a point on the axis. You specify the axis and value from which to draw the line.
A marker range is a rectangular area that highlights a range of values. You specify between which values and from which axis to draw the rectangle.
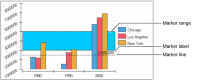
For example, Figure 22‑78 shows a marker line and a marker range.
Figure 22‑78 Chart using a marker line and a marker range
Both markers highlight points on the y-axis. The marker line uses a label to show the marker value. You can change the style or color of the marker, change label text, or hide labels. Add a marker to an x-axis only if it shows numeric or date‑and‑time data. Adding a marker to an axis that shows text values as categories generally does not help users read the chart.
Adding an axis marker
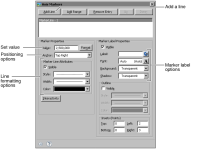
To create and format an axis marker, navigate to the Format Chart section for the axis, then choose Markers to see the options shown in Figure 22‑79.
Figure 22‑79 Axis Markers formatting options
Adding a marker line
To create a marker line, choose Add Line. The marker appears in the marker list. In Value, type the value at which the line should start.
Adding a marker range
To create an axis marker range, choose Add Range. Options to set range properties appear in Marker Properties. To set values that the range marker spans, type numeric values in Start Value and End Value.
Formatting axis markers
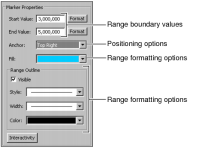
A marker displays a label to identify the axis point or range that the marker highlights. You can adjust the line style, width, and color of a marker line, or change the range fill color or outline of a marker range. You can also specify an image to be used as a marker on the chart. To format a marker line or range, use the formatting options shown in Figure 22‑79 or Figure 22‑80.
Figure 22‑80 Range marker formatting options
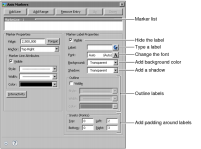
To hide or format a marker label, select a name from the marker list, then set the corresponding properties, as shown in Figure 22‑81.