Typically, a chart displays each axis intersecting the opposing axis at the minimum value. Specifying an axis intersection setting defines the value at which the axis meets the opposing axis. Select one of the following values:
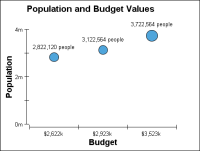
Min to have the axis intersect the opposing axis at the opposing axis’s minimum value. Figure 22‑92 shows an x-axis intersecting the minimum value of the y-axis.
Figure 22‑92 Y-axis Min intersection option
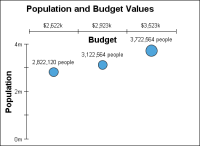
Max to have the axis intersect the opposing axis at the opposing axis’s maximum value. Figure 22‑93 shows an x-axis intersecting the maximum value of the y-axis.
Figure 22‑93 Y-axis Max intersection option
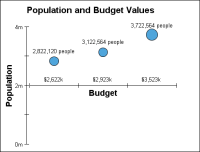
Value to have the axis intersect the opposing axis at a value that you specify. Figure 22‑94 shows an x-axis intersecting the y-axis at 1500.
Figure 22‑94 Y-axis Value intersection option
To set the intersection of an axis, on Format Chart, navigate to the page for that axis. In Origin, select Min, Max, or Value as the intersection setting. If you select Value, you must provide a value at which to join the axes.