The scale of an axis determines the range of values displayed on a linear, logarithmic, or date-and-time axis. When you first create a chart, the chart builder selects a maximum and a minimum axis value to fit the data that the axis displays. Typically, the chart builder selects a minimum value that is just below the lowest axis value and a maximum value that is just higher than the highest axis value, rounding down or up to the nearest major unit, so the markings on the axis span the range of data that it displays.
You can change the following settings:
The minimum and maximum values for an axis.
The span between major grid values and the number of minor grid marks between major grid values on the axis. The distance between major grid marks is the step value. The number of minor grid marks is the minor grid count.
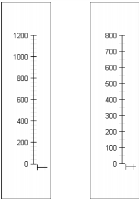
For example, in Figure 22‑95, the axis on the left shows values from 0 to 1200. The step value is 200, so the major grid marks indicate values of 200, 400, and so on. The minor grid count is five grid marks for each major unit. The axis on the right shows values from 0 to 800. The step value is 100, so the major grid marks indicate 100, 200, and so on. The minor grid count is two grid marks for each major unit.
Figure 22‑95 Axes using different scale options
You can set the scale of value axes only. Category axes do not support scale changes. The following procedures describe how to set the scale of an x-axis. To set the scale of a y-axis, complete the same steps on the y-axis page. Most scale items appear in the Scale dialog. To set the number of minor grid marks per major unit, you use the Gridlines dialog.
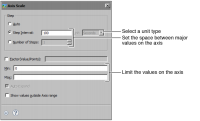
To define the scale of an axis, in Format Chart, navigate to the axis section, then choose Scale. Use the Scale options to change the range and divisions of data on an axis. Figure 22‑96 shows the scale options for a y‑axis that uses a linear data type.
Figure 22‑96 Scale options
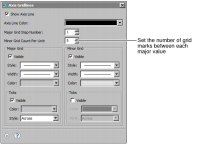
To define the minor grid count, on Format Chart, navigate to the axis, then choose Gridlines. Use Minor Grid Count Per Unit to set the number of minor grid lines between major tick marks, as shown in Figure 22‑97. You can use this setting only if Visible is selected.