The report debugger tool in BIRT provides functionality similar to other debugger frameworks, such as those in Java and C++ IDEs. The BIRT report debugger enables users to run reports step by step, set breakpoints, inspect instance properties, and watch and evaluate variable values in certain contexts. Using the debugger supports advanced report developers in spotting the errors in report designs quickly and making it easy to understand and identify exceptions during run time.
Unlike the standard Java debugger, the report debugger is based on the report object model tree. The report debugger provides the following functionality:
Checking JavaScript expression syntax
Debugging JavaScript event handlers
Debugging Java event handlers
Debugging report execution exceptions
Inspecting the report item instance and variable values
Based on the standard Eclipse debugging framework, the report debugger framework enhances the Eclipse built-in debugging features.
The BIRT report debugger consists of the following parts:
Report JavaScript debugger
Report Java EventHandler debugger
In earlier versions of BIRT, the Java EventHandler debugger required setting an Eclipse Workbench start-up parameter. In the current release, the new mechanism allows direct debugging of the report engine in the JVM.
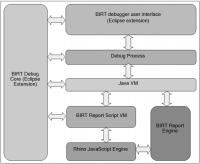
The JavaScript debugger is implemented as a BIRT report script virtual machine (VM). The VM extends the standard Eclipse debug extension point and communicates directly with the Eclipse debugging framework. This VM handles all script debugging tasks, such as managing breakpoints, communicating with the engine task thread, and reporting to Eclipse listeners. Figure 41‑1 presents the BIRT debugger architecture.