Users can set breakpoints on JavaScript code at specific execution points. During debugging, execution stops at a breakpoint and the user can inspect variables in the current context.
To debug JavaScript code, switch to the script editor and set a breakpoint by double‑clicking the left border at a specific line.
The BIRT report debugger uses the standard Eclipse debugging feature. This chapter provides only basic details about the debugger main components. Refer to the Eclipse documentation for more information about the debugger.
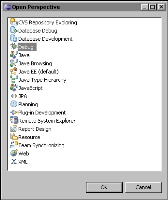
You manage the debugging or running of reports in the Debug perspective. To open the Debug perspective, choose Window➛Open Perspective➛Other➛Debug, as shown in Figure 41‑5.
Figure 41‑5 Selecting the Debug perspective
The Debug perspective and its views are shown in Figure 41‑6.
Figure 41‑6 The upper portion of the Debug perspective
The Debug perspective contains the following views:
Debug view
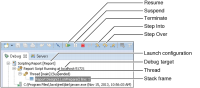
The Debug view shows reports you are currently debugging as well as any others you were debugging before you terminated them. This view includes processes and threads associated with the reports. An example of a Debug view is shown in Figure 41‑7.
The launch configuration entry appears at the top of the tree structure for each report you are debugging.
Each configuration has a debug target. A debug target is a running instance of a JVM executing code. Debug targets have properties that are useful for understanding the context in which the code is executing, the Java command line and JVM parameters, and the class path information.
The Debug view displays suspended threads for each report you are debugging. Each thread in your program appears as a node in the tree under the debug target.
You can think of a stack frame as a method invocation. When one method invokes another, a stack frame is added to the top of the stack. When the method returns, that stack frame is removed from the top of the stack. An example of a stack frame appears as selected in Figure 41‑7.
Figure 41‑7 Debug view
The Debug view provides the main buttons to control the debugging process, as described in Table 41‑1.
Table 41‑1 Debugger user interface buttons
Icon
Button
Action
Resume
Resumes a suspended thread.
Step Into
Steps into the highlighted statement.
Step Over
Steps over the current statement. Execution continues at the next line in the same method or, if at the end of a method, in the method calling the current method. The cursor jumps to the declaration of the method. The line to execute is highlighted.
Suspend
Suspends the selected thread of a target so that you can browse or modify code, inspect data.
Terminate
Terminates the selected debug target.
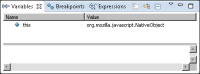
Variables view
Displays information about the variables associated with the stack frame selected in the Debug view, as shown in Figure 41‑8.
Figure 41‑8 Variables view
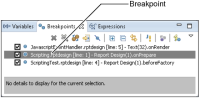
Breakpoints view
Lists all the breakpoints you currently have set in your workspace. Figure 41‑9 shows a breakpoint highlighted in the Breakpoints view.
Figure 41‑9 List of breakpoints
Double-click a breakpoint to display its location in the script editor. You can delete, add, enable, or disable breakpoints. You can group breakpoints by working set or set hit counts.
Expressions view
Displays selected variables defined and manipulated in the script code. The script editor and other views used by the Debug perspective appear in the lower portion of the Eclipse Workbench, as shown in Figure 41‑10.
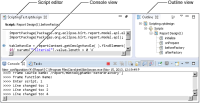
Figure 41‑10 Script, Console, and Outline views
Script editor
Shows the script you are debugging in the Debug and Report Design perspectives.
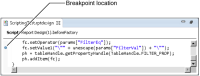
In Script, to set a breakpoint, double-click the vertical border on the left side at a specific line, as shown in Figure 41‑11. The breakpoint appears in the border as a blue circle. The breakpoint is also added in the Breakpoints view, as shown in Figure 41‑9.
Figure 41‑11 Setting a breakpoint
Outline view
Shows the report structure in the Debug and Report Design perspectives. In the Debug perspective, this view shows only the scripts defined in the report design, as shown in Figure 41‑10.
Console view
Displays a variety of consoles depending on the type development and the current user settings.
The process console in the Debug perspective, shown in Figure 41‑10, displays the output of a process and accepts keyboard input to a process. The process console displays the following three kinds of text:
Standard error
Standard input
Standard output
To specify different colors for these kinds of text, choose Window➛Preferences. Then, in Preferences, expand Run/Debug, and select Console.