Use the dashboard editor to add new or existing gadgets to the dashboard. Choose Insert and select a gadget category, such as charts. Then choose the type of chart gadget, such as a bar chart. The gadget builder for the selected gadget type appears for you to select content to display in the gadget.
If you have existing gadget files in your BIRT application folder, choose Insert➛Gadget Gallery to open the file browser and search for the gadget file to add to the dashboard. You can place the gadget where you want on the dashboard and edit the gadget options to change its format and other settings. You can save dashboard gadgets as gadget files using Information Console.
Placing a gadget
New gadgets use the dashboard layout when added. You can move existing gadgets on the dashboard to a different column or set the gadget to float when the dashboard uses the column layout. You can place floating gadgets anywhere on the dashboard while other gadgets remain in the column layout. Select Dock from the gadget menu to return a floating gadget to the column layout of a dashboard.
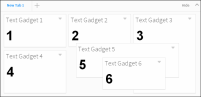
If the dashboard uses a column layout, you can move the gadgets above or below other gadgets in the same column. Gadgets in a column layout do not overlap and have an adjustable height. If the dashboard uses a freeform layout, all gadgets are floating. Floating gadgets have an adjustable height and width. When the freeform grid is displayed, you can snap gadgets to a grid for precise placement. Figure 15‑13 shows gadgets in a three‑column layout with two floating gadgets. Gadget 5 and gadget 6 are floating, in this example.
Figure 15‑13 Gadgets in a three-column layout with floating gadgets
How to add a new gadget to a dashboard
BIRT Designer Professional includes gadget templates to quickly add visual content to your dashboard. Use BIRT iHub to create your own gadgets that you can import into your project.
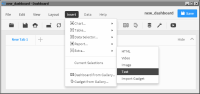
1 In the dashboard editor, choose Insert➛Extra➛Text to open the gadget builder, as shown in Figure 15‑14.
Figure 15‑14 Adding a gadget to the dashboard
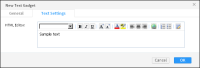
2 Complete the gadget configuration depending on the gadget you choose. This example uses a text gadget. Choose OK when you are finished configuring the gadget, as shown in as shown in Figure 15‑15.
Figure 15‑15 Configuring a new gadget
The selected gadget appears on the dashboard.
How to change the size of a gadget
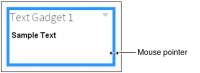
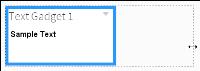
1 Hover the mouse pointer over the border of a gadget. A solid line appears, highlighting the borders that you can modify, as shown in Figure 15‑16.
Figure 15‑16 Selecting a gadget border to change
2 Drag the border and drop it at a new position to resize the gadget, as shown in Figure 15‑17.
Figure 15‑17 Changing the size of a gadget
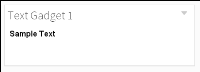
3 The gadget resizes to the new dimension, as shown in Figure 15‑18.
Figure 15‑18 Displaying the new gadget dimensions
Formatting a gadget
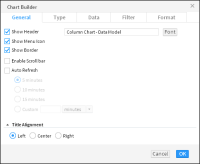
Gadget formatting options are available in the general properties of a gadget. To reach the general properties of a gadget, choose Edit. Then, choose General.
Figure 15‑19 shows the general gadget properties of a column chart gadget. Each gadget type includes additional formatting options, depending on the content of the gadget.
Figure 15‑19 Navigating to a dashboard file
You can personalize gadgets with the following formatting options:
Auto Refresh, to refresh the gadget at a selected interval
Dimensions, to set the width and height of the gadget after it is added to the dashboard
Enable Scroll Bar, to display a scrollbar if the gadget is too small for the content it displays
Font, to select a font for the gadget title
Gadget Title, to customize the name of the gadget
Show Border, to display the gadget border
Show Header, to display the header
Show Menu Icon, to display a gadget’s editing icon
Show Toolbar, to display a toolbar for a cross tab, parameter, report, or table gadget
Title Alignment, to set the alignment of the gadget title
Testing dashboard content
After adding the gadgets you require, it is important to verify that the dashboard meets your expectations. In the dashboard editor you can choose View➛Run to open the dashboard in a read‑only mode.
The following considerations assist in optimizing a dashboard:
Avoid long queries when on-demand data is not required by using data object store files instead of data object design files. Object store files are cached in the BIRT iHub, enabling multiple users to quickly access data.
Avoid delays in rendering BIRT content by using BIRT report document files in place of BIRT report design files when possible. This avoids the additional time necessary for data population of a report design file.
If you are showing only selected parts of a BIRT design file, consider using a BIRT library. A BIRT design file renders every item in the file, even if only part of the file is being used, such as content displayed in a Reportlet gadget. A BIRT library only renders the requested content.
Activate dashboard auto refresh only when necessary to monitor changing data.
If you display data selection gadgets, such as a list, consider using data objects with optimized indexes for quick population of the gadget.
Consider building data cubes to aggregate data before the data is displayed. For example, a table gadget that aggregates values requires the browser to load all values before it can calculate the aggregate values. If a cross tab was used to display a data cube of the same data, there is less network traffic and less processing done by the web browser.