BIRT charts have fixed dimensions. This is useful when preparing documents that can be printed but mobile users often expect a chart to fill the available space in their web browser.
Using the JavaScript API you can add scripts that detect the current size of the BIRT viewer and resize the chart to make maximum use of the current viewer size. You can use the following APIs to resize your chart:
viewer.getChart().setSize(width, height)
Works for all chart formats. You submit the changes and request the iHub server to update the report design and rebuild the report
Works for HTML5 charts. This script does not require submit but only changes the chart in the browser and not at the server.
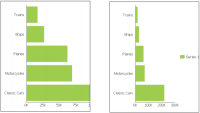
Figure 43‑2 show the results of resizing a chart on a smaller display.
Figure 43‑2 Resizing a chart to fit available space using scripts
An example script to resize the HTML5 chart appears in Listing 43‑1. This script retrieves the default size of a chart and the current size of the BIRT viewer. These values are then used to change the width of the chart to the current width of the BIRT viewer.
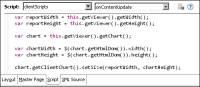
Listing 43‑1 Example script to resize an HTML5 chart
You can add this script to the BIRT document’s clientScripts onContentUpdate event, as shown in Figure 43‑3.
Figure 43‑3 Adding a client script to onContentUpdate that resizes a chart
For more information about scripting report content, see Chapter 5, “Creating dynamic report content using the Actuate JavaScript API,” in Integrating Applications into BIRT iHub.