Actuate provides a number of templates illustrating the integration with third‑party visualization components. You can select and preview any of the provided templates. The templates have hard-coded sample data that demonstrates the integrated third‑party visualizations. You typically modify the templates to bind the data to a visualization, to change a visualization appearance, or change a visualization behavior.
Editing templates
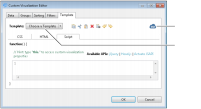
Select Template in Custom Visualization Editor to choose a template and edit the code for a custom visualization. A template consists of JavaScript, HTML, and CSS code, as shown in Figure 19‑5.
Figure 19‑5 Using the Custom Visualization editor
The text editor provides basic text formatting options for editing scripts with syntax highlighting. The HTML editor offers tag autocompletion.
Note that switching to another template loads the selected template scripts, and discards the changes you made to the current template. To preserve your template, save the current report design. To create a new version of your template, create a new report.
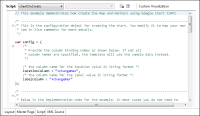
For more elaborate script editing, choose a Custom Visualization item in Layout, and select Script editor. In Script, choose clientOnCreate event, as shown in Figure 19‑6.
Figure 19‑6 Editing templates in the script editor
To preview the code you entered, you can use Web Viewer or JSFiddle.
Custom Visualization Editor supports JSFiddle, a free code-sharing tool that allows you to edit, share, execute, and debug web code within a browser.
Binding data in templates
To customize a template to display your own data, you must follow these steps:
Bind the data you want to use to the Custom Visualization item. You select from the data defined in the application data sets and report items.
Configure additional grouping, sorting, and filters, and add an aggregation. This step may not be needed, but it can be helpful to prepare the data in a format required by a visualization.
Modify a selected template to map your data to the third‑party visualization data.
To simplify the data mapping process, the templates declare configuration arrays with data elements. You must change the array definition to provide the names of the data columns from the data you have bound. For example, in the code lines in Listing 19‑1, you must replace the strings marked as <changeme> with the names of the matching columns.
Listing 19‑1 Configuration array before update
var config = {
locationColumn : "<changeme>",
labelColumn : "<changeme>"
};
After the update, the code appears as the one shown in Listing 19‑2.
Listing 19‑2 Configuration array after update
var config = {
locationColumn : "COUNTRY",
labelColumn : "customer-count"
};
Modify a template to change the visualization appearance and behavior. This level of customization requires more extensive knowledge about the third‑party visualization APIs.
The next two tutorials provide step‑by‑step instructions on how to create a Google Map from Google Charts, and a multilevel pie chart custom visualization.