Scripting a Custom Visualization item involves using three categories of APIs:
The external JSAPI libraries integrated with Actuate JSAPI
The API defined by the third‑party visualizations
The Custom Visualization JavaScript API and Actuate JSAPI
Using external libraries integrated with Actuate JSAPI
Actuate JSAPI is integrated with the following external libraries:
HeadJS
HeadJS is a library for responsive design, feature detections, and resource loading. You can find more information about this library at http://headjs.com/.
RequireJS
RequireJS is a JavaScript file and module loader. You can find more information about this library at http://requirejs.org/.
jQuery
jQuery is a JavaScript library for HTML document traversal and manipulation, event handling, animation, and Ajax, with an API that works across a multitude of browsers. You can find more information about this library at http://jquery.com/.
Using the third‑party visualization API
The Custom Visualization report item provides templates for embedding visualizations from multiple different vendors. Each visualization supports different APIs. The templates load the required resources. To customize the templates and make changes in the visualization style or behavior, you must be familiar with the API of the third‑party visualization you integrate.
Using the Custom Visualization API
The Custom Visualization API is a part of Actuate JSAPI. When scripting in templates you can use Actuate JSAPI.
The Custom Visualization API consists of methods defined in the CustomViz item object. These methods, listed in Table 19‑1, provide access to the Custom Visualization component options, the data bound to the report item, and the properties used to handle the Custom Visualization item printing.
Sets the timeout value in milliseconds before the printing starts
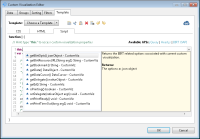
You can access these properties and functions through the this object, as shown in Figure 19‑24.
Figure 19‑24 Using the this object to display a list of functions and properties
To use the this object, type the keyword, this, followed by a period in the script window of the Custom Visualization object or the script editor for the event handler. A scrollable list of all the properties and functions for the element appears. Scroll down the list and press Enter or double-click when the property or function you want is highlighted.
Using getBirtResourceURL
This API converts a resource file path to a BIRT resource URL. You use this API when loading local resources. For example, the following lines of code load files from the Flash Object Library resources folder. The code uses the head.load(...) method from the headJS library to load the files.
The BIRT engine places the Custom Visualization HTML code in a separate <div> element and assigns an ID to this element. The getID( ) method returns the ID of this <div> element. You typically use the ID when formatting the custom visualization appearance in the template JavaScript code.
For example, the code shown in Listing 19‑5 obtains the container element ID, along with the container height and width, and assigns them to the relevant FusionCharts properties.
Listing 19‑5 Getting the <div> container ID
var containerId = this.getId();
var containerWidth = $("#" + containerId).width();
var containerHeight = $("#" + containerId).height();
...
var revenueChart = new FusionCharts({
type : "MultiLevelPie",
renderAt : containerId,
width : containerWidth,
height : containerHeight,
dataFormat : "json",
dataSource : data_source
});
You have the option to assign your own ID to the <div> element in the HTML editor and define a style for this <div> in the CSS editor.
Using getBirtOpts
You use the getBirtOpts( ) method to get the Custom Visualization object options set in the report itself, such as height, width, theme, and bookmark. Typically, you use the height, width, and theme options when you set the properties for the third‑party visualization in the template.
The getBirtOpts( ) method returns a JSON object, containing all the item properties. You can retrieve the properties and assign them to local variables by using the following lines of code:
var height = this.getBirtOpts().height;
var width = this.getBirtOpts().width;
var bookmark = this.getBirtOpts().bookmark;
var theme = this.getBirtOpts().theme;
For example, the heat map from Highcharts visualization supports themes, so you can see an example of setting up a theme in the heat map template:
var birtOpts = this.getBirtOpts();
if (birtOpts.theme == "Modern") {
chartConfig.colorAxis.minColor = "#B0D24E";
chartConfig.colorAxis.maxColor = "#C53C34";
}
Getting a bookmark
A bookmark is a marker for finding a place in a report. Each report item has a bookmark, either generated by the BIRT engine or manually created by you. The BIRT engine assigns the bookmark as an ID to the <div> element in the HTML presentation of the report. You use the bookmark property in mash-up pages or web applications to get a handle of an object in the HTML viewer. Actuate JSAPI requires a bookmark as a parameter in multiple functions.
There are two ways to obtain the Custom Visualization item bookmark:
Using getBirtOpts( )
var bookmark = this.getBirtOpts().bookmark;
Using getBookmark( )
var bookmark = this.getBookmark();
Using the API to get data
There are two API calls to get the data, getData( ) and getDataCursor( ). These APIs retrieve the data that is bound to a Custom Visualization item. You use them depending on the data format the third‑party visualization requires.
Using getData
The getData( ) call returns the raw data, along with column names and display names. These parameters are respectively stored in arrays, named columns, labels, and rows. For example, the following line of code returns the name of the first column in the data set.
var col1 = this.getData().columns[0];
The next lines of code check if there is any data bound to the Custom Visualization item.
if (customViz.getData().columns.length == 0) {
returnnull;
}
The following code returns the display name of the first column:
var displayName1 = this.getData().labels[0];
The row[ ] [ ] array is two-dimensional; the first dimension points to the data row and the second to the column in the data row. For example, the following line of code returns the data of the first column in the second row:
var elem1 = this.getData().rows[1][0];
Using getDataCursor
This API provides two methods for accessing the data:
hasNext( )
Use this method to check if there is data in the data set.
next( )
This method returns a data row from the data set.
You can see multiple examples about how to map data using getDataCursor( ) in the templates in the Custom Visualization editor. The example in Listing 19‑6 illustrates how to loop through the data set and assign row columns to the third‑party visualization data fields. The third‑party visualization requires the data to be stored in a chartData[ ] array using two elements, data and visits. The code uses the getDataCursor.next( ) function to iterate through the data rows and directly maps the data using the row[ColumnName] reference.
Listing 19‑6 Mapping data columns using the row[ColumnName] reference
var cursor = this.getDataCursor();
var chartData = [];
while(cursor.hasNext()) {
var row = cursor.next();
chartData.push({
date: row["SHIPPEDDATE"],
visits: Number(row["ORDERCOUNT"] )
});
}
The example in Listing 19‑7 shows you how to use cursor.next( ) to reference columns from the custom visualization’s data.
Listing 19‑7 Mapping data columns using cursor.next( )
var config = {
/* the column name in Numeric format */
numberColumn : "<changeme>",
/* the column name for the date value in Date format */
dateColumn : "<changeme>"
};
...
var cursor = this.getDataCursor();
var rows = [];
while (cursor.hasNext()) {
var rowData = cursor.next();
var row = [];
row.push(new Date(rowData[config.dateColumn]));
row.push(Number(rowData[config.numberColumn]));
rows.push(row);
}
Using setDelegate and getDelegate
Using a delegate supports encapsulating a reference to the third‑party visualization inside the custom visualization.
setDelegate(native Object arg1)
Use setDelegate( ) to pass a reference to the integrated third‑party visualization in the Custom Visualization item.
The next two lines of code, included in the dygraphs from dygraphs template, illustrate creating an object reference to a dygraphs chart and setting a delegate reference to this object in the custom visualization.
var graphChart = makeGraph();
customViz.setDelegate(graphChart);
getDelegate( )
Returns the internal delegate object associated with the current custom visualization.
You typically use this call in web applications or single-page applications that only use the Actuate Visualization Library and the Actuate REST API to render visualizations.
Printing custom visualizations
The printing APIs control the visualization printing process. When you request printing, by default, the BIRT engine waits for one second before sending a BIRT application to print. Depending on your implementation, your visualization might require more time to render. The loading times for the templates may vary based on the third party vendor API, the network traffic, or custom systems. If you export a visualization to formats like PDF, or DOC, before it is completely rendered, you might see a partially loaded output. The Custom Visualization printing APIs give you tools to control the printing process and time the printing request.
When using the Custom Visualization printing APIs, you must select an appropriate place in your implementation to make the calls. A good place would be at the end of a callback class, if your third‑party visualization supports it.
Using setPrintReady
Call setPrintReady( ) after your visualization is done with all data processing and rendering. The method indicates that it is safe to print the visualization.
this.setPrintReady();
In some cases you cannot predict when the visualization will be completely loaded, and you may need to adjust the call timing. The next line of code demonstrates how to delay the setPrintReady( ) call by 5 seconds.
If a visualization requires more time to render, you can delay the printing until your visualization is completely rendered. You increase the default timeout of 1 second to the time needed.
The example shown in the following lines of code sets the printing timeout to 10 seconds. The duration of the example animation is 10 seconds, and the printing must be delayed by 10 seconds, to avoid getting an incomplete image of the visualization printed. The input parameter is in milliseconds.
customViz.setPrintTimeOut(10000);
animate(10000);
Using isPrinting
In some visualizations you need to stop the animation if a print request is submitted.
The following lines of code illustrate such usage: