A template typically contains visual elements, such as tables, charts, and labels, and can also contain defined data sets which provide the data for a report. A template can also be a complete report that presents professionally formatted data. As you create a template, consider what data the user needs to use in the report, how the user wants to present the data, and what the user needs as a starting point for the report. The following section provides tips for creating effective templates.
Separating or combining visual and data elements
When designing a template, you can either include both visual and data elements in the template or keep them separate. Templates that contain only visual elements are more versatile. The user can mix and match data objects with these templates. Separating presentation from data can be efficient and optimal, if developers with design and data‑retrieval expertise closely collaborate to ensure that the templates and data are suitable for use together.
Designing themes
A theme is a collection of styles that can specify the colors used in a report, the font used for different text, label, or data items, the spacing or alignment of items, border styles, and so on. Designers create a theme to apply a consistent style or appearance to a report.
When you create a template, consider creating different themes, so that the user can choose from multiple styles. The creation of a theme is optional. Themes are stored in a BIRT library file, separate from the template file.
Defining all the styles in a theme within a library makes it easier to maintain and update the appearance of a template. When a user requests new or modified styles to use with a particular template, update the theme in the library, then publish the latest version of the library to the server. You do not need to modify the template file each time.
Improving usability
A template should enable the user to quickly determine how to use and freely edit most elements in it. The following guidelines enable you to improve the usability of a template:
Set the following optional template properties:
The display name of the template
The display name should represent the purpose of the template, such as a list or cross tab. If you do not specify a display name, the name of the template file is used.
A brief description of the template
A description provides additional information that helps the user decide which template to use, appearing as a tooltip when the user hovers the mouse pointer over the thumbnail image of the template.
The image to use as the thumbnail image of the template
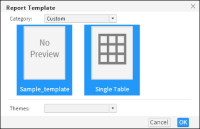
An image provides a graphical preview of the template. If you do not provide an image, a gray box appears displaying the text, “No preview”.
Report Template, shown in Figure 26‑1, compares two template images in Report Studio. The first thumbnail image shows a template for which properties are not specified. The next one shows a template for which general properties are set. As shown in Figure 26‑1, it is easier for a user to decide which template to select if you specify properties when creating the template.
Figure 26‑1 Displaying two templates: one without properties set and the other with properties set
Decide which report elements in the template are editable. Examples of editable elements include labels for displaying report titles, section titles, or column headings, and empty tables into which users insert data. Examples of non-editable elements include company logos and standard copyright statements.
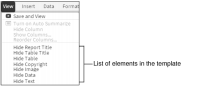
Provide meaningful names for each report element, so the user can easily identify the element. If you do not specify a name, Report Studio displays the name of the element type, such as Text or Label. The View menu, shown in Figure 26‑2, lists all the elements in one of the default templates, so users can choose whether to display or hide the elements in the report.
Figure 26‑2 Report items listing all the template elements
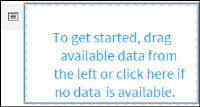
Provide instructions for using each editable element. For example, a table can display a message, such as “To get started, drag available data from the left or click here if no data is available,” shown in Figure 26‑3.