This section provides step-by-step instructions for building a dashboard to display data from the data object you finished in the previous tutorial. In this tutorial, you perform the following tasks:
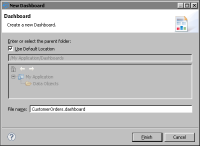
1 Choose File➛New➛Dashboard. New Dashboard displays possible locations for the dashboard.
2 In File name, type the following text, as shown in Figure 4‑20:
CustomerOrders.dashboard
Figure 4‑20 New dashboard
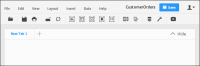
3 To add the dashboard to the project, choose Finish. The dashboard editor appears, as shown in Figure 4‑21. If you configured BIRT Designer Professional to use an external web browser to display reports and dashboards, the dashboard editor appears in your selected web browser.
Figure 4‑21 Dashboard editor
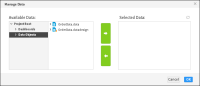
Choose Data➛Manage Data. The available data objects in your project are displayed, as shown in Figure 4‑22.
Figure 4‑22 Available data objects
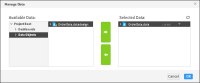
Select OrderData.data and choose Add to use this data object in the dashboard. The selected data object appears in Selected Data, as shown in Figure 4‑23.
Figure 4‑23 Selected data objects
4 Choose OK to close Manage Data.
5 Choose File➛Save to save your latest changes to the dashboard file.
Task 2: Add a table
Now that the dashboard is created and data is assigned to it, you can choose gadgets to display the data. When you choose a table gadget, data is either listed row by row or summarized in groups. For this tutorial we use a summary table to provide an overview of the data.
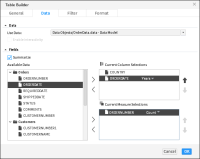
1 Choose Insert➛Table➛Table to open the Table Builder.
2 In Available Data, select Customers➛COUNTRY, and choose Add to add it to Current Column Selections.
3 In Available Data, select Orders➛ORDERDATE, and choose Add to add it to Current Column Selections. In Date Value, select Years.
In Available Data, select Orders➛ORDERNUMBER, and choose Add to add it to Current Measure Selections. In Sum, select Count. Figure 4‑24 shows table builder after these changes.
Figure 4‑24 Building a table
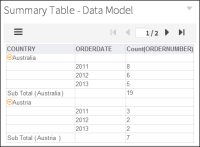
Choose OK to add the table to the dashboard. The table appears on the dashboard, as shown in Figure 4‑25.
Figure 4‑25 New table gadget
4 Choose File➛Save to save your latest changes to the dashboard file.
Task 3: Add a chart
Charts help users quickly visualize data. You can choose the chart that best presents your data and enable interactive features such as drill down, zoom and time selection. You can also filter and format data presented in your chart. In this tutorial we are using a pie chart to display data.
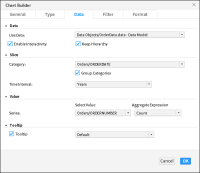
1 Choose Insert➛Chart➛Pie Chart to open the chart builder.
2 In Slice—Category, select Orders➛ORDERDATE. In Slice—Time Interval, select Years.
3 In Value—Select Value, select Orders➛ORDERNUMBER. In Value—Aggregate Expression, select Count. Figure 4‑26 shows Chart Builder after these changes.
Figure 4‑26 Building a chart
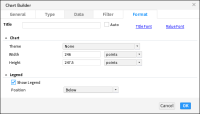
4 Choose Format.
5 Expand Legend and select Show Legend. In Position, select Below, as shown in Figure 4‑27.
Figure 4‑27 Displaying a legend
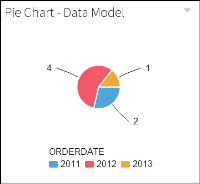
Choose OK to add the chart to the dashboard. The chart appears on the dashboard, as shown in Figure 4‑28.
Figure 4‑28 New chart gadget
6 Choose File➛Save to save your latest changes to the dashboard file.
Task 4: Add a data selection gadget
Use a data selection gadget such as a list to enable users to search for data on a dashboard. One or more gadgets can link to the data selection so that a single user selection can update multiple charts and tables on the dashboard. In this tutorial we add a list of countries for a user to select. After the user selects a country, the other gadgets update and display data about the selected country.
1 Choose Insert➛Data Selector➛List to open the Data Selector Gadget Wizard.
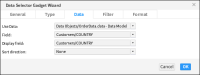
2 In Field, choose Customers➛COUNTRY, as shown in Figure 4‑29.
Figure 4‑29 Building a data selector
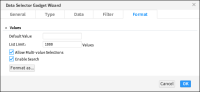
3 Choose Format and select Enable Search, as shown in Figure 4‑30.
Figure 4‑30 Enabling user search
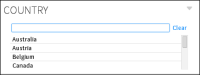
Choose OK to add the list of countries to the dashboard. The list appears on the dashboard, as shown in Figure 4‑31.
Figure 4‑31 New list gadget
4 Click on the Pie Chart title. Drag the chart and drop it to the right side of the list gadget.
5 Resize the bottom of the chart gadget so that it matches the bottom of the table gadget.
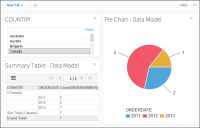
6 In the COUNTRY list, choose Canada. Your dashboard should look similar to Figure 4‑32.
Figure 4‑32 Using a list to filter data
7 Choose File➛Save to save your latest changes to the dashboard file.
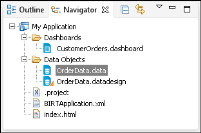
8 Close the dashboard editor. You can now see the dashboard in the Navigator view, as shown in Figure 4‑33.